

Details for Person Re-identification Baseline
455
Table 1. The influence of the resize ratio of the pedestrian image
Resize ratio Rank-1 Rank-5 Rank-10 mAP
264 × 132
88.12
95.01
96.79
70.61
268 × 134
88.09
95.22
96.97
71.16
272 × 136
88.84 95.64 97.39
71.72
276 × 138
88.12
95.25
96.79
71.10
280 × 140
88.03
95.43
96.97
70.88
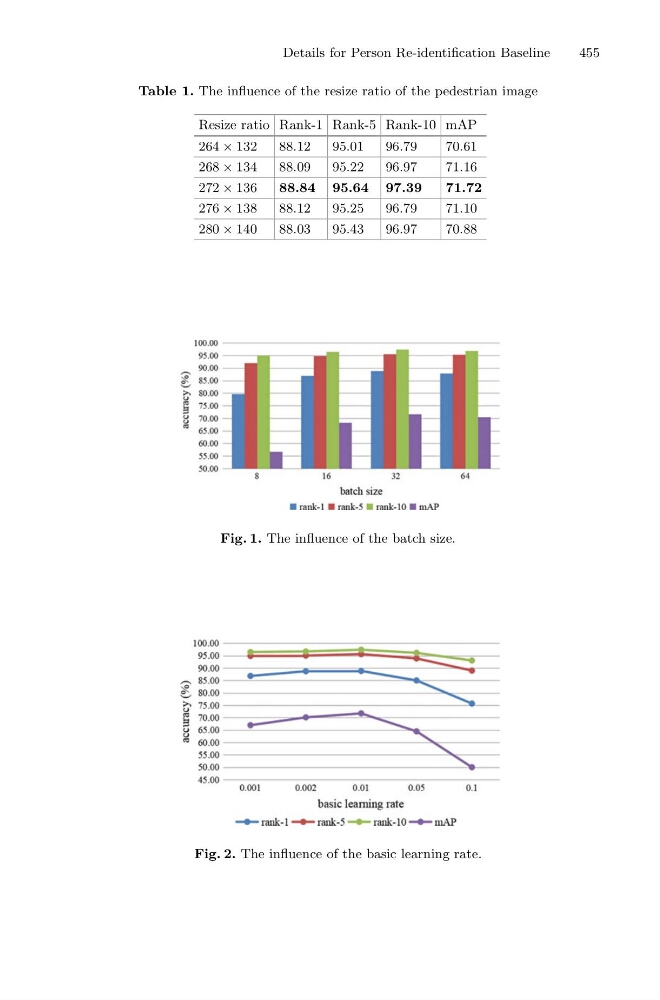
Fig. 1. The influence of the batch size.
Fig. 2. The influence of the basic learning rate.