

454
Z. Zhang et al.
In the stage of training, we firstly resize each image into a fixed shape, and
then the resized image is randomly cropped and fed into the modified ResNet-50.
During the test stage, we only resize the pedestrian image, and then the feature
vector f could be learned from the trained deep model to represent each query
and gallery image for computing distance between them.
2.3 Loss Function
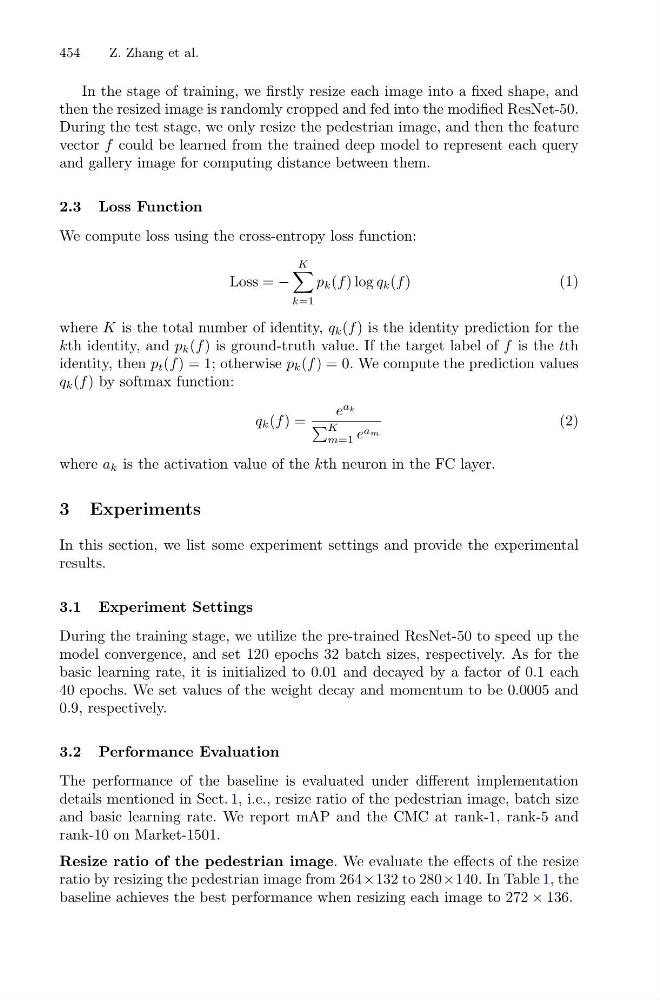
We compute loss using the cross-entropy loss function:
Loss = −
K
k=1
p k (f ) log q k (f )
(1)
where K is the total number of identity, q k (f ) is the identity prediction for the
kth identity, and p k (f ) is ground-truth value. If the target label of f is the tth
identity, then p t (f ) = 1; otherwise p k (f ) = 0. We compute the prediction values
q k (f ) by softmax function:
q k (f ) =
e
a k
K
m=1 e am
(2)
where a k is the activation value of the kth neuron in the FC layer.
3 Experiments
In this section, we list some experiment settings and provide the experimental
results.
3.1 Experiment Settings
During the training stage, we utilize the pre-trained ResNet-50 to speed up the
model convergence, and set 120 epochs 32 batch sizes, respectively. As for the
basic learning rate, it is initialized to 0.01 and decayed by a factor of 0.1 each
40 epochs. We set values of the weight decay and momentum to be 0.0005 and
0.9, respectively.
3.2 Performance Evaluation
The performance of the baseline is evaluated under different implementation
details mentioned in Sect. 1, i.e., resize ratio of the pedestrian image, batch size
and basic learning rate. We report mAP and the CMC at rank-1, rank-5 and
rank-10 on Market-1501.
Resize ratio of the pedestrian image. We evaluate the effects of the resize
ratio by resizing the pedestrian image from 264×132 to 280×140. In Table 1, the
baseline achieves the best performance when resizing each image to 272 × 136.