

3.2 Correlation Graphic Model
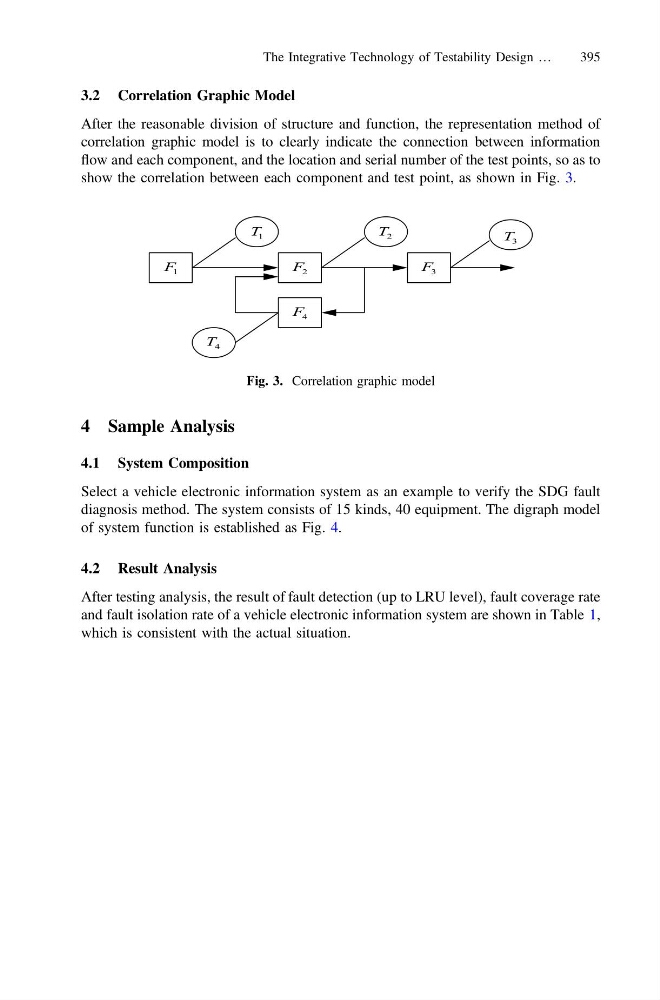
After the reasonable division of structure and function, the representation method of
correlation graphic model is to clearly indicate the connection between information
flow and each component, and the location and serial number of the test points, so as to
show the correlation between each component and test point, as shown in Fig. 3.
4 Sample Analysis
4.1 System Composition
Select a vehicle electronic information system as an example to verify the SDG fault
diagnosis method. The system consists of 15 kinds, 40 equipment. The digraph model
of system function is established as Fig. 4.
4.2 Result Analysis
After testing analysis, the result of fault detection (up to LRU level), fault coverage rate
and fault isolation rate of a vehicle electronic information system are shown in Table 1,
which is consistent with the actual situation.
1
F
2
F
3
F
4
F
1
T
3
T
4
T
2
T
Fig. 3. Correlation graphic model
The Integrative Technology of Testability Design …
395
After the reasonable division of structure and function, the representation method of
correlation graphic model is to clearly indicate the connection between information
flow and each component, and the location and serial number of the test points, so as to
show the correlation between each component and test point, as shown in Fig. 3.
4 Sample Analysis
4.1 System Composition
Select a vehicle electronic information system as an example to verify the SDG fault
diagnosis method. The system consists of 15 kinds, 40 equipment. The digraph model
of system function is established as Fig. 4.
4.2 Result Analysis
After testing analysis, the result of fault detection (up to LRU level), fault coverage rate
and fault isolation rate of a vehicle electronic information system are shown in Table 1,
which is consistent with the actual situation.
1
F
2
F
3
F
4
F
1
T
3
T
4
T
2
T
Fig. 3. Correlation graphic model
The Integrative Technology of Testability Design …
395