

4.1 Average Spectrum Efficiency
In order to assess the communication quality of the coverage area, the average spectrum
efficiency (ASE) indicator is adopted. The simulation parameters are set as
M ¼ 12 Â 8, Z h ¼ 8, Z v ¼ 6, M RF ¼ 8, and Q h ¼ Q v ¼ 8.
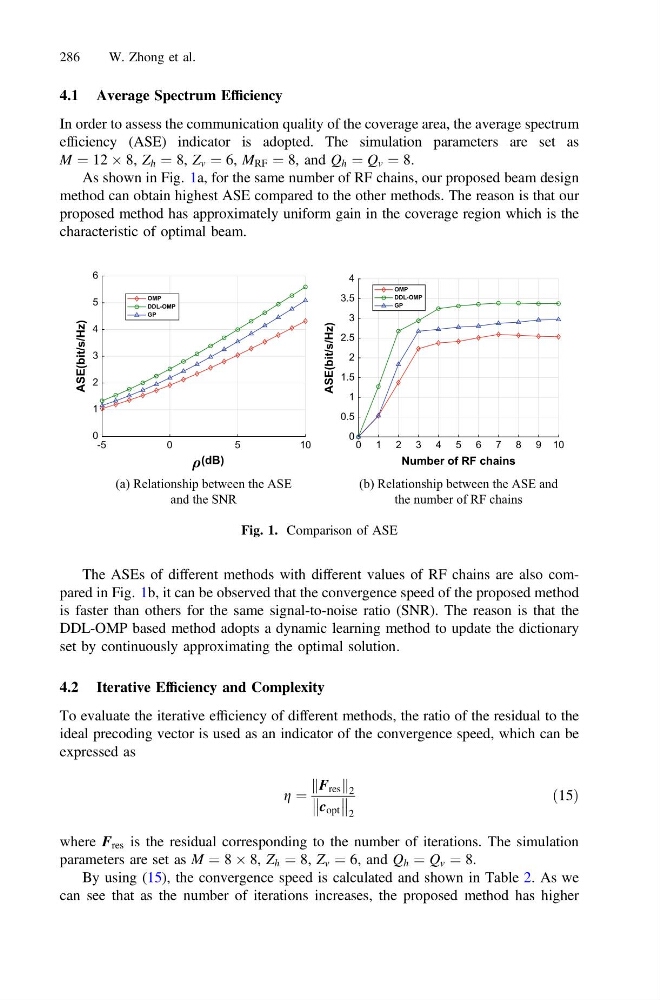
As shown in Fig. 1a, for the same number of RF chains, our proposed beam design
method can obtain highest ASE compared to the other methods. The reason is that our
proposed method has approximately uniform gain in the coverage region which is the
characteristic of optimal beam.
The ASEs of different methods with different values of RF chains are also compared in Fig. 1b, it can be observed that the convergence speed of the proposed method
is faster than others for the same signal-to-noise ratio (SNR). The reason is that the
DDL-OMP based method adopts a dynamic learning method to update the dictionary
set by continuously approximating the optimal solution.
4.2 Iterative Efficiency and Complexity
To evaluate the iterative efficiency of different methods, the ratio of the residual to the
ideal precoding vector is used as an indicator of the convergence speed, which can be
expressed as
g ¼
F res
k
k 2
c opt
2
ð15Þ
where F res is the residual corresponding to the number of iterations. The simulation
parameters are set as M ¼ 8 Â 8, Z h ¼ 8, Z v ¼ 6, and Q h ¼ Q v ¼ 8.
By using (15), the convergence speed is calculated and shown in Table 2. As we
can see that as the number of iterations increases, the proposed method has higher
(a) Relationship between the ASE
and the SNR
(b) Relationship between the ASE and
the number of RF chains
-5
0
5
10
(dB)
0
1
2
3
4
5
6
ASE(bit/s/Hz)
OMP
DDL-OMP
GP
0 1 2 3 4 5 6 7 8 9 10
Number of RF chains
0
0.5
1
1.5
2
2.5
3
3.5
4
ASE(bit/s/Hz)
OMP
DDL-OMP
GP
Fig. 1. Comparison of ASE
286
W. Zhong et al.
In order to assess the communication quality of the coverage area, the average spectrum
efficiency (ASE) indicator is adopted. The simulation parameters are set as
M ¼ 12 Â 8, Z h ¼ 8, Z v ¼ 6, M RF ¼ 8, and Q h ¼ Q v ¼ 8.
As shown in Fig. 1a, for the same number of RF chains, our proposed beam design
method can obtain highest ASE compared to the other methods. The reason is that our
proposed method has approximately uniform gain in the coverage region which is the
characteristic of optimal beam.
The ASEs of different methods with different values of RF chains are also compared in Fig. 1b, it can be observed that the convergence speed of the proposed method
is faster than others for the same signal-to-noise ratio (SNR). The reason is that the
DDL-OMP based method adopts a dynamic learning method to update the dictionary
set by continuously approximating the optimal solution.
4.2 Iterative Efficiency and Complexity
To evaluate the iterative efficiency of different methods, the ratio of the residual to the
ideal precoding vector is used as an indicator of the convergence speed, which can be
expressed as
g ¼
F res
k
k 2
c opt
2
ð15Þ
where F res is the residual corresponding to the number of iterations. The simulation
parameters are set as M ¼ 8 Â 8, Z h ¼ 8, Z v ¼ 6, and Q h ¼ Q v ¼ 8.
By using (15), the convergence speed is calculated and shown in Table 2. As we
can see that as the number of iterations increases, the proposed method has higher
(a) Relationship between the ASE
and the SNR
(b) Relationship between the ASE and
the number of RF chains
-5
0
5
10
(dB)
0
1
2
3
4
5
6
ASE(bit/s/Hz)
OMP
DDL-OMP
GP
0 1 2 3 4 5 6 7 8 9 10
Number of RF chains
0
0.5
1
1.5
2
2.5
3
3.5
4
ASE(bit/s/Hz)
OMP
DDL-OMP
GP
Fig. 1. Comparison of ASE
286
W. Zhong et al.