

blocks is measured by p-value. When this p-value is smaller than 0.05, we can draw the
conclusion that there are obvious differences between two data blocks, that is, concept
drift occurs. When p-value is greater than 0.05, we accept the original assumption to
draw the conclusion that there are no obvious differences between two data blocks. We
accept the initial hypothesis, it means there is no concept drift.
3 Experimental Process and Results
3.1 Experimental Process
Two data sets are used in experiments, one is simulation data set and the other is radar
data set. For the simulation dataset and real dataset experiments, experiments cut the
dataset into 12 data blocks, labels them in order, and calculates p-value according to the
above model method.
The noise-free simulation data set that has been generated by python is named
CIRCLES. The samples are labeled based on a circular function: if a sample is within
the circle, then its label is positive; if a sample is beyond the circle, then its label is
negative. Concept drift occurs when shifting the center and increasing the size of the
circle. Each data block contains 30 samples and each sample contains 2 values. This
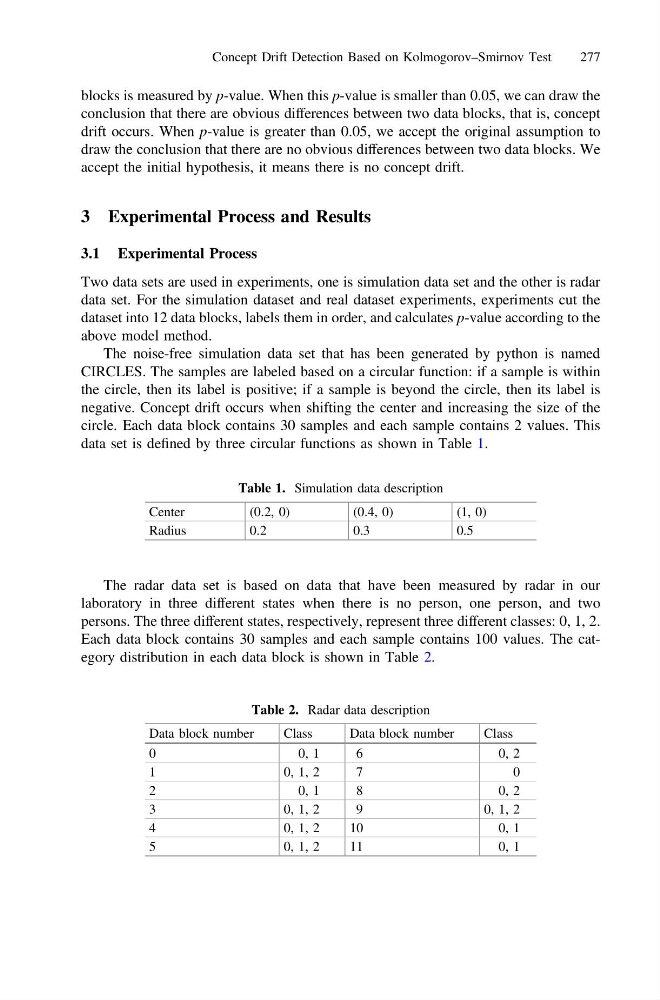
data set is defined by three circular functions as shown in Table 1.
The radar data set is based on data that have been measured by radar in our
laboratory in three different states when there is no person, one person, and two
persons. The three different states, respectively, represent three different classes: 0, 1, 2.
Each data block contains 30 samples and each sample contains 100 values. The category distribution in each data block is shown in Table 2.
Table 1. Simulation data description
Center
(0.2, 0)
(0.4, 0)
(1, 0)
Radius
0.2
0.3
0.5
Table 2. Radar data description
Data block number
Class
Data block number
Class
0
0 , 1
6
0 , 2
1
0 , 1 , 2
7
0
2
0 , 1
8
0 , 2
3
0, 1, 2
9
0, 1, 2
4
0, 1, 2
10
0, 1
5
0, 1, 2
11
0, 1
Concept Drift Detection Based on Kolmogorov–Smirnov Test
277
conclusion that there are obvious differences between two data blocks, that is, concept
drift occurs. When p-value is greater than 0.05, we accept the original assumption to
draw the conclusion that there are no obvious differences between two data blocks. We
accept the initial hypothesis, it means there is no concept drift.
3 Experimental Process and Results
3.1 Experimental Process
Two data sets are used in experiments, one is simulation data set and the other is radar
data set. For the simulation dataset and real dataset experiments, experiments cut the
dataset into 12 data blocks, labels them in order, and calculates p-value according to the
above model method.
The noise-free simulation data set that has been generated by python is named
CIRCLES. The samples are labeled based on a circular function: if a sample is within
the circle, then its label is positive; if a sample is beyond the circle, then its label is
negative. Concept drift occurs when shifting the center and increasing the size of the
circle. Each data block contains 30 samples and each sample contains 2 values. This
data set is defined by three circular functions as shown in Table 1.
The radar data set is based on data that have been measured by radar in our
laboratory in three different states when there is no person, one person, and two
persons. The three different states, respectively, represent three different classes: 0, 1, 2.
Each data block contains 30 samples and each sample contains 100 values. The category distribution in each data block is shown in Table 2.
Table 1. Simulation data description
Center
(0.2, 0)
(0.4, 0)
(1, 0)
Radius
0.2
0.3
0.5
Table 2. Radar data description
Data block number
Class
Data block number
Class
0
0 , 1
6
0 , 2
1
0 , 1 , 2
7
0
2
0 , 1
8
0 , 2
3
0, 1, 2
9
0, 1, 2
4
0, 1, 2
10
0, 1
5
0, 1, 2
11
0, 1
Concept Drift Detection Based on Kolmogorov–Smirnov Test
277