

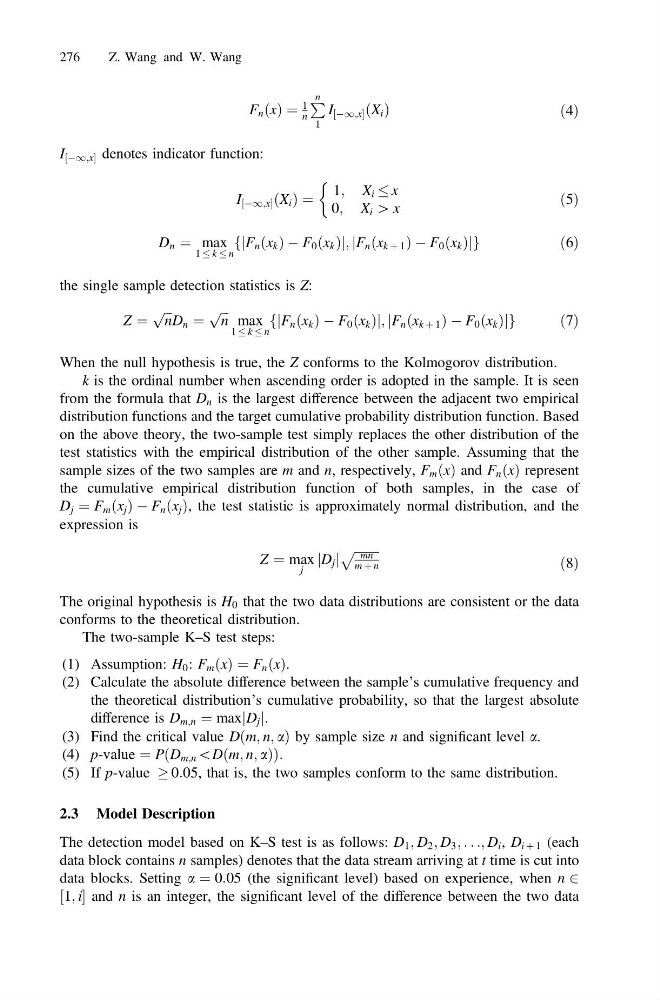
F n ðxÞ ¼
1
n
P n
1
I ½À1;x ðX i Þ
ð4Þ
I ½À1;x denotes indicator function:
I ½À1;x ðX i Þ ¼
1; X i x
0; X i [ x
ð5Þ
D n ¼ max
1 k n
fjF n ðx k Þ À F 0 ðx k Þj; jF n ðx k þ 1 Þ À F 0 ðx k Þjg
ð6Þ
the single sample detection statistics is Z:
Z ¼
ffiffi ffi
n
p
D n ¼
ffiffi ffi
n
p
max
1 k n
fjF n ðx k Þ À F 0 ðx k Þj; jF n ðx k þ 1 Þ À F 0 ðx k Þjg
ð7Þ
When the null hypothesis is true, the Z conforms to the Kolmogorov distribution.
k is the ordinal number when ascending order is adopted in the sample. It is seen
from the formula that D n is the largest difference between the adjacent two empirical
distribution functions and the target cumulative probability distribution function. Based
on the above theory, the two-sample test simply replaces the other distribution of the
test statistics with the empirical distribution of the other sample. Assuming that the
sample sizes of the two samples are m and n, respectively, F m ðxÞ and F n ðxÞ represent
the cumulative empirical distribution function of both samples, in the case of
D j ¼ F m ðx j Þ À F n ðx j Þ, the test statistic is approximately normal distribution, and the
expression is
Z ¼ max
j
jD j j
ffiffiffiffiffiffiffiffi mn
m þ n
p
ð8Þ
The original hypothesis is H 0 that the two data distributions are consistent or the data
conforms to the theoretical distribution.
The two-sample K–S test steps:
(1) Assumption: H 0 : F m ðxÞ ¼ F n ðxÞ.
(2) Calculate the absolute difference between the sample’s cumulative frequency and
the theoretical distribution’s cumulative probability, so that the largest absolute
difference is D m;n ¼ maxjD j j.
(3) Find the critical value Dðm; n; aÞ by sample size n and significant level a.
(4) p-value ¼ PðD m;n \Dðm; n; aÞÞ:
(5) If p-value ! 0:05, that is, the two samples conform to the same distribution.
2.3 Model Description
The detection model based on K–S test is as follows: D 1 ; D 2 ; D 3 ; . . .; D i , D i þ 1 (each
data block contains n samples) denotes that the data stream arriving at t time is cut into
data blocks. Setting a ¼ 0:05 (the significant level) based on experience, when n 2
½1; i and n is an integer, the significant level of the difference between the two data
276
Z. Wang and W. Wang
1
n
P n
1
I ½À1;x ðX i Þ
ð4Þ
I ½À1;x denotes indicator function:
I ½À1;x ðX i Þ ¼
1; X i x
0; X i [ x
ð5Þ
D n ¼ max
1 k n
fjF n ðx k Þ À F 0 ðx k Þj; jF n ðx k þ 1 Þ À F 0 ðx k Þjg
ð6Þ
the single sample detection statistics is Z:
Z ¼
ffiffi ffi
n
p
D n ¼
ffiffi ffi
n
p
max
1 k n
fjF n ðx k Þ À F 0 ðx k Þj; jF n ðx k þ 1 Þ À F 0 ðx k Þjg
ð7Þ
When the null hypothesis is true, the Z conforms to the Kolmogorov distribution.
k is the ordinal number when ascending order is adopted in the sample. It is seen
from the formula that D n is the largest difference between the adjacent two empirical
distribution functions and the target cumulative probability distribution function. Based
on the above theory, the two-sample test simply replaces the other distribution of the
test statistics with the empirical distribution of the other sample. Assuming that the
sample sizes of the two samples are m and n, respectively, F m ðxÞ and F n ðxÞ represent
the cumulative empirical distribution function of both samples, in the case of
D j ¼ F m ðx j Þ À F n ðx j Þ, the test statistic is approximately normal distribution, and the
expression is
Z ¼ max
j
jD j j
ffiffiffiffiffiffiffiffi mn
m þ n
p
ð8Þ
The original hypothesis is H 0 that the two data distributions are consistent or the data
conforms to the theoretical distribution.
The two-sample K–S test steps:
(1) Assumption: H 0 : F m ðxÞ ¼ F n ðxÞ.
(2) Calculate the absolute difference between the sample’s cumulative frequency and
the theoretical distribution’s cumulative probability, so that the largest absolute
difference is D m;n ¼ maxjD j j.
(3) Find the critical value Dðm; n; aÞ by sample size n and significant level a.
(4) p-value ¼ PðD m;n \Dðm; n; aÞÞ:
(5) If p-value ! 0:05, that is, the two samples conform to the same distribution.
2.3 Model Description
The detection model based on K–S test is as follows: D 1 ; D 2 ; D 3 ; . . .; D i , D i þ 1 (each
data block contains n samples) denotes that the data stream arriving at t time is cut into
data blocks. Setting a ¼ 0:05 (the significant level) based on experience, when n 2
½1; i and n is an integer, the significant level of the difference between the two data
276
Z. Wang and W. Wang