

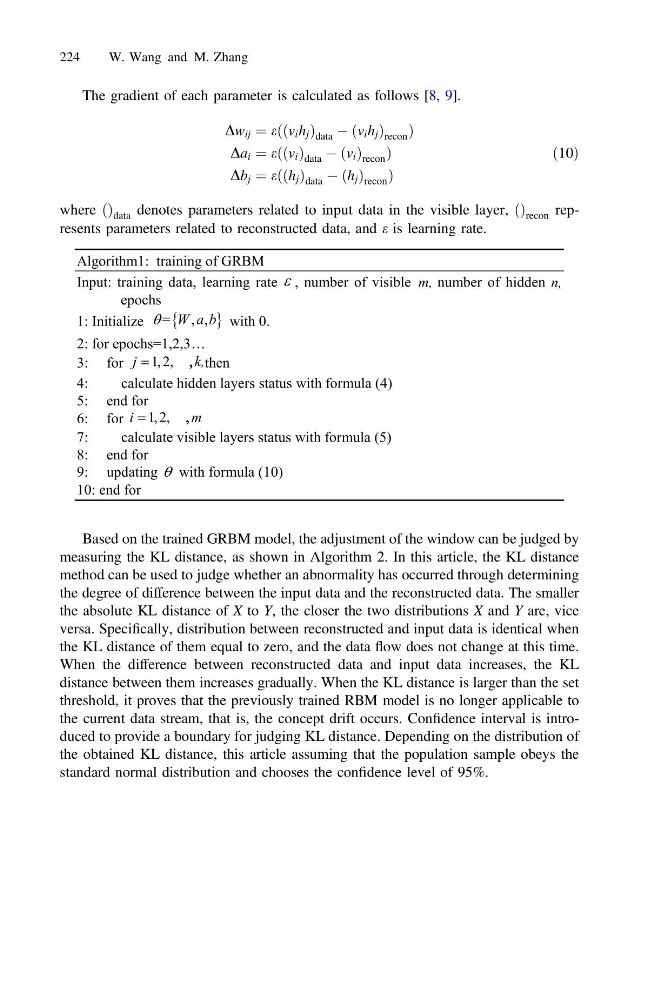
The gradient of each parameter is calculated as follows [8, 9].
Dw ij ¼ eððv i h j Þ data À ðv i h j Þ recon Þ
Da i ¼ eððv i Þ data À ðv i Þ recon Þ
Db j ¼ eððh j Þ data À ðh j Þ recon Þ
ð10Þ
where ðÞ data denotes parameters related to input data in the visible layer, ðÞ recon represents parameters related to reconstructed data, and e is learning rate.
m,
m
k,
n,
Based on the trained GRBM model, the adjustment of the window can be judged by
measuring the KL distance, as shown in Algorithm 2. In this article, the KL distance
method can be used to judge whether an abnormality has occurred through determining
the degree of difference between the input data and the reconstructed data. The smaller
the absolute KL distance of X to Y, the closer the two distributions X and Y are, vice
versa. Specifically, distribution between reconstructed and input data is identical when
the KL distance of them equal to zero, and the data flow does not change at this time.
When the difference between reconstructed data and input data increases, the KL
distance between them increases gradually. When the KL distance is larger than the set
threshold, it proves that the previously trained RBM model is no longer applicable to
the current data stream, that is, the concept drift occurs. Confidence interval is introduced to provide a boundary for judging KL distance. Depending on the distribution of
the obtained KL distance, this article assuming that the population sample obeys the
standard normal distribution and chooses the confidence level of 95%.
224
W. Wang and M. Zhang
Dw ij ¼ eððv i h j Þ data À ðv i h j Þ recon Þ
Da i ¼ eððv i Þ data À ðv i Þ recon Þ
Db j ¼ eððh j Þ data À ðh j Þ recon Þ
ð10Þ
where ðÞ data denotes parameters related to input data in the visible layer, ðÞ recon represents parameters related to reconstructed data, and e is learning rate.
m,
m
k,
n,
Based on the trained GRBM model, the adjustment of the window can be judged by
measuring the KL distance, as shown in Algorithm 2. In this article, the KL distance
method can be used to judge whether an abnormality has occurred through determining
the degree of difference between the input data and the reconstructed data. The smaller
the absolute KL distance of X to Y, the closer the two distributions X and Y are, vice
versa. Specifically, distribution between reconstructed and input data is identical when
the KL distance of them equal to zero, and the data flow does not change at this time.
When the difference between reconstructed data and input data increases, the KL
distance between them increases gradually. When the KL distance is larger than the set
threshold, it proves that the previously trained RBM model is no longer applicable to
the current data stream, that is, the concept drift occurs. Confidence interval is introduced to provide a boundary for judging KL distance. Depending on the distribution of
the obtained KL distance, this article assuming that the population sample obeys the
standard normal distribution and chooses the confidence level of 95%.
224
W. Wang and M. Zhang