

4.4 Comparison of Prediction Results
In order to better verify the prediction effect, the results are compared with principal
component analysis prediction, as shown in Table 3. The prediction of 59–62 samples
showed that the Lasso average prediction error was 4.8%, and the principal component
regression prediction average error was 14.4%. The prediction accuracy based on the
Lasso multiple regression model was higher, which also indicated that the Lasso feature
screening method was superior to principal component analysis method.
Meanwhile, the average relative variance (ARV) and root mean square error
(RMSE) are introduced as the error evaluation criteria to comprehensively evaluate the
prediction accuracy and generalization ability of the model. The smaller the ARV
value, the stronger the generalization ability of the prediction model. The smaller the
RMSE value, the higher the accuracy of the prediction model. A comprehensive
comparison of the effects of two different prediction models is shown in Table 4.
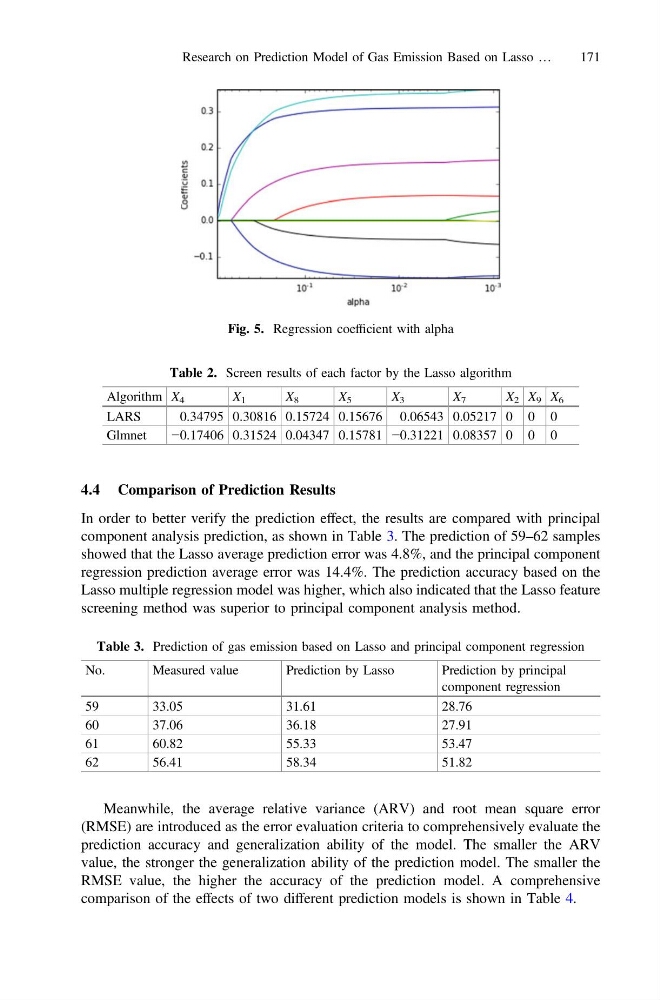
Fig. 5. Regression coefficient with alpha
Table 2. Screen results of each factor by the Lasso algorithm
Algorithm X 4
X 1
X 8
X 5
X 3
X 7
X 2 X 9 X 6
LARS
0.34795 0.30816 0.15724 0.15676 0.06543 0.05217 0 0 0
Glmnet
−0.17406 0.31524 0.04347 0.15781 −0.31221 0.08357 0 0 0
Table 3. Prediction of gas emission based on Lasso and principal component regression
No.
Measured value
Prediction by Lasso
Prediction by principal
component regression
59
33.05
31.61
28.76
60
37.06
36.18
27.91
61
60.82
55.33
53.47
62
56.41
58.34
51.82
Research on Prediction Model of Gas Emission Based on Lasso …
171
In order to better verify the prediction effect, the results are compared with principal
component analysis prediction, as shown in Table 3. The prediction of 59–62 samples
showed that the Lasso average prediction error was 4.8%, and the principal component
regression prediction average error was 14.4%. The prediction accuracy based on the
Lasso multiple regression model was higher, which also indicated that the Lasso feature
screening method was superior to principal component analysis method.
Meanwhile, the average relative variance (ARV) and root mean square error
(RMSE) are introduced as the error evaluation criteria to comprehensively evaluate the
prediction accuracy and generalization ability of the model. The smaller the ARV
value, the stronger the generalization ability of the prediction model. The smaller the
RMSE value, the higher the accuracy of the prediction model. A comprehensive
comparison of the effects of two different prediction models is shown in Table 4.
Fig. 5. Regression coefficient with alpha
Table 2. Screen results of each factor by the Lasso algorithm
Algorithm X 4
X 1
X 8
X 5
X 3
X 7
X 2 X 9 X 6
LARS
0.34795 0.30816 0.15724 0.15676 0.06543 0.05217 0 0 0
Glmnet
−0.17406 0.31524 0.04347 0.15781 −0.31221 0.08357 0 0 0
Table 3. Prediction of gas emission based on Lasso and principal component regression
No.
Measured value
Prediction by Lasso
Prediction by principal
component regression
59
33.05
31.61
28.76
60
37.06
36.18
27.91
61
60.82
55.33
53.47
62
56.41
58.34
51.82
Research on Prediction Model of Gas Emission Based on Lasso …
171