

5.11 Current–Voltage Characteristics of the G.M. Counter
83
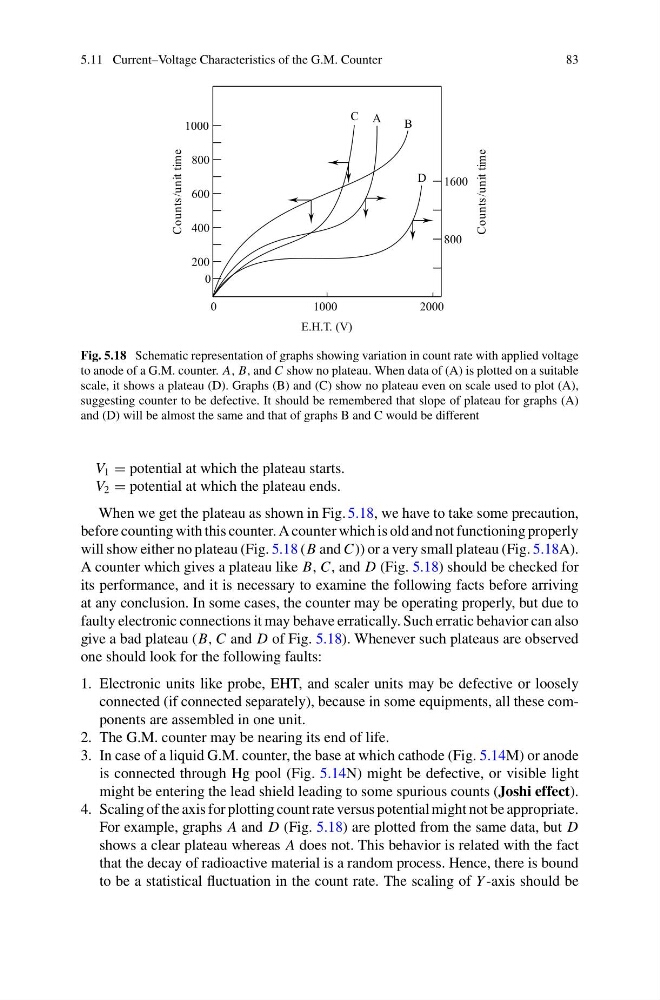
Fig. 5.18 Schematic representation of graphs showing variation in count rate with applied voltage
to anode of a G.M. counter. A, B, and C show no plateau. When data of (A) is plotted on a suitable
scale, it shows a plateau (D). Graphs (B) and (C) show no plateau even on scale used to plot (A),
suggesting counter to be defective. It should be remembered that slope of plateau for graphs (A)
and (D) will be almost the same and that of graphs B and C would be different
V 1 = potential at which the plateau starts.
V 2 = potential at which the plateau ends.
When we get the plateau as shown in Fig. 5.18, we have to take some precaution,
before counting with this counter. A counter which is old and not functioning properly
will show either no plateau (Fig. 5.18 (B and C)) or a very small plateau (Fig. 5.18A).
A counter which gives a plateau like B, C, and D (Fig. 5.18) should be checked for
its performance, and it is necessary to examine the following facts before arriving
at any conclusion. In some cases, the counter may be operating properly, but due to
faulty electronic connections it may behave erratically. Such erratic behavior can also
give a bad plateau (B, C and D of Fig. 5.18). Whenever such plateaus are observed
one should look for the following faults:
1. Electronic units like probe, EHT, and scaler units may be defective or loosely
connected (if connected separately), because in some equipments, all these components are assembled in one unit.
2. The G.M. counter may be nearing its end of life.
3. In case of a liquid G.M. counter, the base at which cathode (Fig. 5.14M) or anode
is connected through Hg pool (Fig. 5.14N) might be defective, or visible light
might be entering the lead shield leading to some spurious counts (Joshi effect).
4. Scaling of the axis for plotting count rate versus potential might not be appropriate.
For example, graphs A and D (Fig. 5.18) are plotted from the same data, but D
shows a clear plateau whereas A does not. This behavior is related with the fact
that the decay of radioactive material is a random process. Hence, there is bound
to be a statistical fluctuation in the count rate. The scaling of Y -axis should be
83
Fig. 5.18 Schematic representation of graphs showing variation in count rate with applied voltage
to anode of a G.M. counter. A, B, and C show no plateau. When data of (A) is plotted on a suitable
scale, it shows a plateau (D). Graphs (B) and (C) show no plateau even on scale used to plot (A),
suggesting counter to be defective. It should be remembered that slope of plateau for graphs (A)
and (D) will be almost the same and that of graphs B and C would be different
V 1 = potential at which the plateau starts.
V 2 = potential at which the plateau ends.
When we get the plateau as shown in Fig. 5.18, we have to take some precaution,
before counting with this counter. A counter which is old and not functioning properly
will show either no plateau (Fig. 5.18 (B and C)) or a very small plateau (Fig. 5.18A).
A counter which gives a plateau like B, C, and D (Fig. 5.18) should be checked for
its performance, and it is necessary to examine the following facts before arriving
at any conclusion. In some cases, the counter may be operating properly, but due to
faulty electronic connections it may behave erratically. Such erratic behavior can also
give a bad plateau (B, C and D of Fig. 5.18). Whenever such plateaus are observed
one should look for the following faults:
1. Electronic units like probe, EHT, and scaler units may be defective or loosely
connected (if connected separately), because in some equipments, all these components are assembled in one unit.
2. The G.M. counter may be nearing its end of life.
3. In case of a liquid G.M. counter, the base at which cathode (Fig. 5.14M) or anode
is connected through Hg pool (Fig. 5.14N) might be defective, or visible light
might be entering the lead shield leading to some spurious counts (Joshi effect).
4. Scaling of the axis for plotting count rate versus potential might not be appropriate.
For example, graphs A and D (Fig. 5.18) are plotted from the same data, but D
shows a clear plateau whereas A does not. This behavior is related with the fact
that the decay of radioactive material is a random process. Hence, there is bound
to be a statistical fluctuation in the count rate. The scaling of Y -axis should be