

170
10 Identification of Radioactive Isotopes
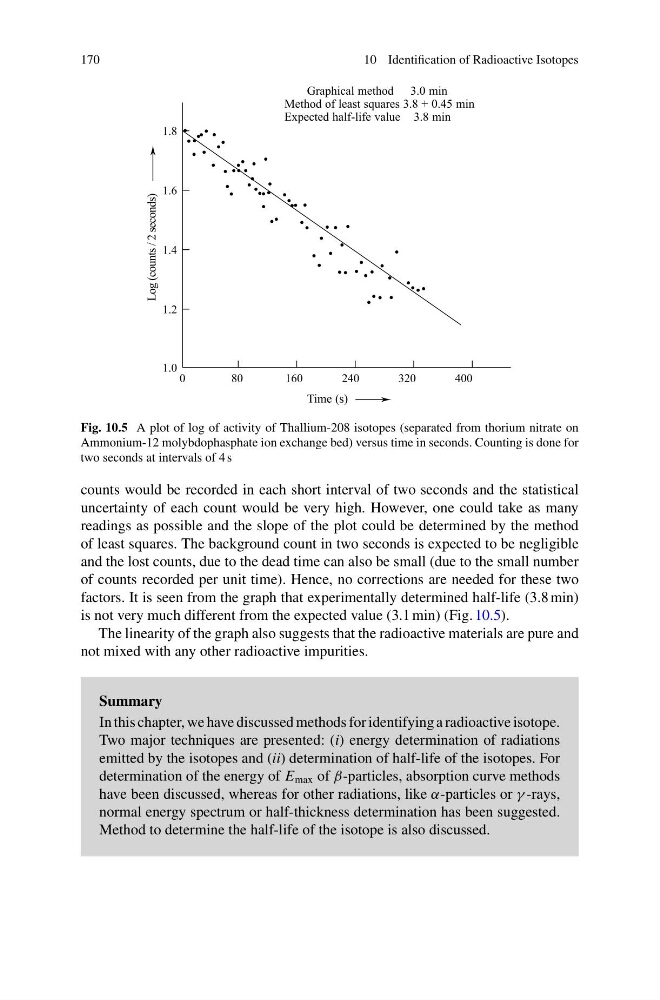
Fig. 10.5 A plot of log of activity of Thallium-208 isotopes (separated from thorium nitrate on
Ammonium-12 molybdophasphate ion exchange bed) versus time in seconds. Counting is done for
two seconds at intervals of 4 s
counts would be recorded in each short interval of two seconds and the statistical
uncertainty of each count would be very high. However, one could take as many
readings as possible and the slope of the plot could be determined by the method
of least squares. The background count in two seconds is expected to be negligible
and the lost counts, due to the dead time can also be small (due to the small number
of counts recorded per unit time). Hence, no corrections are needed for these two
factors. It is seen from the graph that experimentally determined half-life (3.8 min)
is not very much different from the expected value (3.1 min) (Fig. 10.5).
The linearity of the graph also suggests that the radioactive materials are pure and
not mixed with any other radioactive impurities.
Summary
In this chapter, we have discussed methods for identifying a radioactive isotope.
Two major techniques are presented: (i) energy determination of radiations
emitted by the isotopes and (ii) determination of half-life of the isotopes. For
determination of the energy of E max of β-particles, absorption curve methods
have been discussed, whereas for other radiations, like α-particles or γ -rays,
normal energy spectrum or half-thickness determination has been suggested.
Method to determine the half-life of the isotope is also discussed.
10 Identification of Radioactive Isotopes
Fig. 10.5 A plot of log of activity of Thallium-208 isotopes (separated from thorium nitrate on
Ammonium-12 molybdophasphate ion exchange bed) versus time in seconds. Counting is done for
two seconds at intervals of 4 s
counts would be recorded in each short interval of two seconds and the statistical
uncertainty of each count would be very high. However, one could take as many
readings as possible and the slope of the plot could be determined by the method
of least squares. The background count in two seconds is expected to be negligible
and the lost counts, due to the dead time can also be small (due to the small number
of counts recorded per unit time). Hence, no corrections are needed for these two
factors. It is seen from the graph that experimentally determined half-life (3.8 min)
is not very much different from the expected value (3.1 min) (Fig. 10.5).
The linearity of the graph also suggests that the radioactive materials are pure and
not mixed with any other radioactive impurities.
Summary
In this chapter, we have discussed methods for identifying a radioactive isotope.
Two major techniques are presented: (i) energy determination of radiations
emitted by the isotopes and (ii) determination of half-life of the isotopes. For
determination of the energy of E max of β-particles, absorption curve methods
have been discussed, whereas for other radiations, like α-particles or γ -rays,
normal energy spectrum or half-thickness determination has been suggested.
Method to determine the half-life of the isotope is also discussed.