

164
10 Identification of Radioactive Isotopes
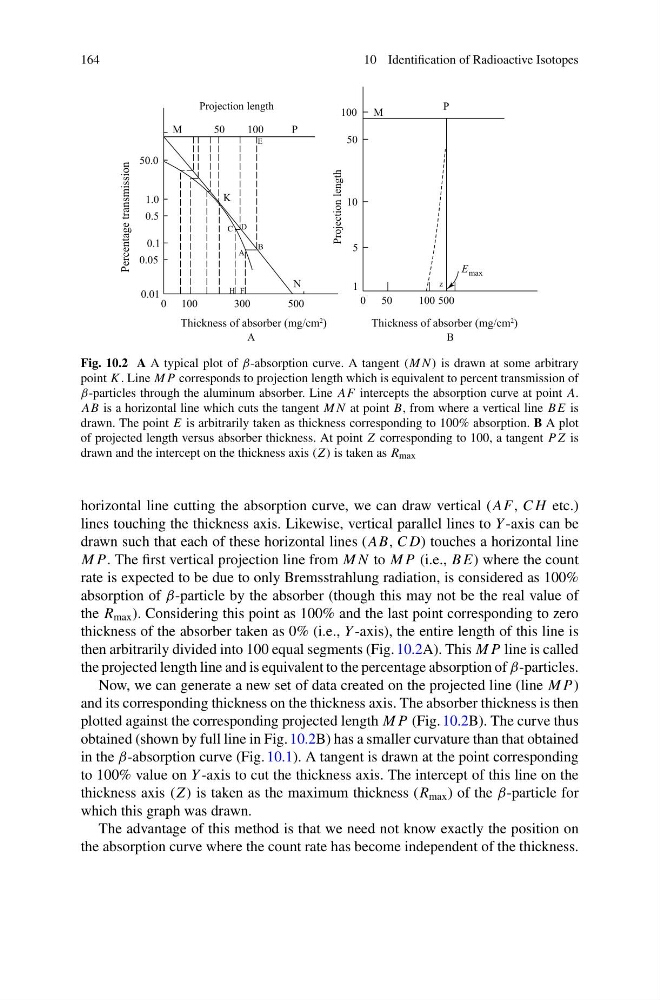
Fig. 10.2 A A typical plot of β-absorption curve. A tangent (M N) is drawn at some arbitrary
point K . Line M P corresponds to projection length which is equivalent to percent transmission of
β-particles through the aluminum absorber. Line AF intercepts the absorption curve at point A.
AB is a horizontal line which cuts the tangent M N at point B, from where a vertical line B E is
drawn. The point E is arbitrarily taken as thickness corresponding to 100% absorption. B A plot
of projected length versus absorber thickness. At point Z corresponding to 100, a tangent P Z is
drawn and the intercept on the thickness axis (Z ) is taken as R max
horizontal line cutting the absorption curve, we can draw vertical ( AF, C H etc.)
lines touching the thickness axis. Likewise, vertical parallel lines to Y -axis can be
drawn such that each of these horizontal lines (AB, C D) touches a horizontal line
M P. The first vertical projection line from M N to M P (i.e., B E) where the count
rate is expected to be due to only Bremsstrahlung radiation, is considered as 100%
absorption of β-particle by the absorber (though this may not be the real value of
the R max ). Considering this point as 100% and the last point corresponding to zero
thickness of the absorber taken as 0% (i.e., Y -axis), the entire length of this line is
then arbitrarily divided into 100 equal segments (Fig. 10.2A). This M P line is called
the projected length line and is equivalent to the percentage absorption of β-particles.
Now, we can generate a new set of data created on the projected line (line M P)
and its corresponding thickness on the thickness axis. The absorber thickness is then
plotted against the corresponding projected length M P (Fig. 10.2B). The curve thus
obtained (shown by full line in Fig. 10.2B) has a smaller curvature than that obtained
in the β-absorption curve (Fig. 10.1). A tangent is drawn at the point corresponding
to 100% value on Y -axis to cut the thickness axis. The intercept of this line on the
thickness axis (Z ) is taken as the maximum thickness (R max ) of the β-particle for
which this graph was drawn.
The advantage of this method is that we need not know exactly the position on
the absorption curve where the count rate has become independent of the thickness.
10 Identification of Radioactive Isotopes
Fig. 10.2 A A typical plot of β-absorption curve. A tangent (M N) is drawn at some arbitrary
point K . Line M P corresponds to projection length which is equivalent to percent transmission of
β-particles through the aluminum absorber. Line AF intercepts the absorption curve at point A.
AB is a horizontal line which cuts the tangent M N at point B, from where a vertical line B E is
drawn. The point E is arbitrarily taken as thickness corresponding to 100% absorption. B A plot
of projected length versus absorber thickness. At point Z corresponding to 100, a tangent P Z is
drawn and the intercept on the thickness axis (Z ) is taken as R max
horizontal line cutting the absorption curve, we can draw vertical ( AF, C H etc.)
lines touching the thickness axis. Likewise, vertical parallel lines to Y -axis can be
drawn such that each of these horizontal lines (AB, C D) touches a horizontal line
M P. The first vertical projection line from M N to M P (i.e., B E) where the count
rate is expected to be due to only Bremsstrahlung radiation, is considered as 100%
absorption of β-particle by the absorber (though this may not be the real value of
the R max ). Considering this point as 100% and the last point corresponding to zero
thickness of the absorber taken as 0% (i.e., Y -axis), the entire length of this line is
then arbitrarily divided into 100 equal segments (Fig. 10.2A). This M P line is called
the projected length line and is equivalent to the percentage absorption of β-particles.
Now, we can generate a new set of data created on the projected line (line M P)
and its corresponding thickness on the thickness axis. The absorber thickness is then
plotted against the corresponding projected length M P (Fig. 10.2B). The curve thus
obtained (shown by full line in Fig. 10.2B) has a smaller curvature than that obtained
in the β-absorption curve (Fig. 10.1). A tangent is drawn at the point corresponding
to 100% value on Y -axis to cut the thickness axis. The intercept of this line on the
thickness axis (Z ) is taken as the maximum thickness (R max ) of the β-particle for
which this graph was drawn.
The advantage of this method is that we need not know exactly the position on
the absorption curve where the count rate has become independent of the thickness.