

10.4 β-Spectrometry
161
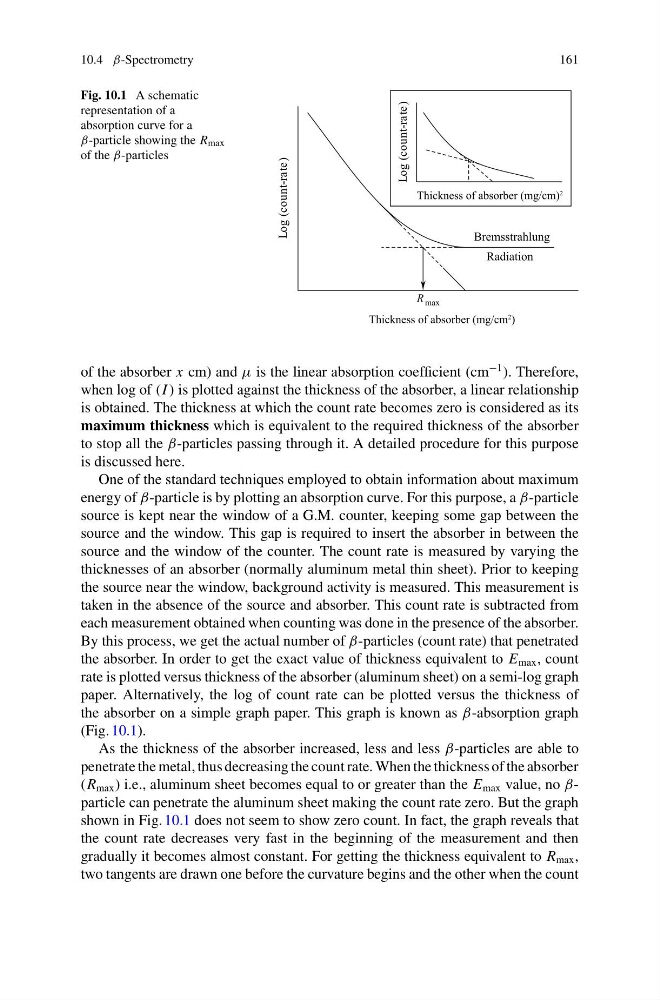
Fig. 10.1 A schematic
representation of a
absorption curve for a
β-particle showing the R max
of the β-particles
of the absorber x cm) and μ is the linear absorption coefficient (cm
−1 ). Therefore,
when log of (I ) is plotted against the thickness of the absorber, a linear relationship
is obtained. The thickness at which the count rate becomes zero is considered as its
maximum thickness which is equivalent to the required thickness of the absorber
to stop all the β-particles passing through it. A detailed procedure for this purpose
is discussed here.
One of the standard techniques employed to obtain information about maximum
energy of β-particle is by plotting an absorption curve. For this purpose, a β-particle
source is kept near the window of a G.M. counter, keeping some gap between the
source and the window. This gap is required to insert the absorber in between the
source and the window of the counter. The count rate is measured by varying the
thicknesses of an absorber (normally aluminum metal thin sheet). Prior to keeping
the source near the window, background activity is measured. This measurement is
taken in the absence of the source and absorber. This count rate is subtracted from
each measurement obtained when counting was done in the presence of the absorber.
By this process, we get the actual number of β-particles (count rate) that penetrated
the absorber. In order to get the exact value of thickness equivalent to E max , count
rate is plotted versus thickness of the absorber (aluminum sheet) on a semi-log graph
paper. Alternatively, the log of count rate can be plotted versus the thickness of
the absorber on a simple graph paper. This graph is known as β-absorption graph
(Fig. 10.1).
As the thickness of the absorber increased, less and less β-particles are able to
penetrate the metal, thus decreasing the count rate. When the thickness of the absorber
(R max ) i.e., aluminum sheet becomes equal to or greater than the E max value, no βparticle can penetrate the aluminum sheet making the count rate zero. But the graph
shown in Fig. 10.1 does not seem to show zero count. In fact, the graph reveals that
the count rate decreases very fast in the beginning of the measurement and then
gradually it becomes almost constant. For getting the thickness equivalent to R max ,
two tangents are drawn one before the curvature begins and the other when the count
161
Fig. 10.1 A schematic
representation of a
absorption curve for a
β-particle showing the R max
of the β-particles
of the absorber x cm) and μ is the linear absorption coefficient (cm
−1 ). Therefore,
when log of (I ) is plotted against the thickness of the absorber, a linear relationship
is obtained. The thickness at which the count rate becomes zero is considered as its
maximum thickness which is equivalent to the required thickness of the absorber
to stop all the β-particles passing through it. A detailed procedure for this purpose
is discussed here.
One of the standard techniques employed to obtain information about maximum
energy of β-particle is by plotting an absorption curve. For this purpose, a β-particle
source is kept near the window of a G.M. counter, keeping some gap between the
source and the window. This gap is required to insert the absorber in between the
source and the window of the counter. The count rate is measured by varying the
thicknesses of an absorber (normally aluminum metal thin sheet). Prior to keeping
the source near the window, background activity is measured. This measurement is
taken in the absence of the source and absorber. This count rate is subtracted from
each measurement obtained when counting was done in the presence of the absorber.
By this process, we get the actual number of β-particles (count rate) that penetrated
the absorber. In order to get the exact value of thickness equivalent to E max , count
rate is plotted versus thickness of the absorber (aluminum sheet) on a semi-log graph
paper. Alternatively, the log of count rate can be plotted versus the thickness of
the absorber on a simple graph paper. This graph is known as β-absorption graph
(Fig. 10.1).
As the thickness of the absorber increased, less and less β-particles are able to
penetrate the metal, thus decreasing the count rate. When the thickness of the absorber
(R max ) i.e., aluminum sheet becomes equal to or greater than the E max value, no βparticle can penetrate the aluminum sheet making the count rate zero. But the graph
shown in Fig. 10.1 does not seem to show zero count. In fact, the graph reveals that
the count rate decreases very fast in the beginning of the measurement and then
gradually it becomes almost constant. For getting the thickness equivalent to R max ,
two tangents are drawn one before the curvature begins and the other when the count