

116
6 Scintillation Counter
of quencher. In this technique, the effect of superimposition of external radiation on
activity of the sample is measured in both channels. From these data, the efficiency
of counting is calculated.
A sample of know activity is recorded in channel A (let it be x 1 cpm), and its
detection efficiency is calculated as before. i.e.,
f =
x 1 × 100
x dpm
(6.2)
where x dpm is expected activity of the sample in terms of disintegration per minute.
An external source of known activity is put on the top of sample tube (not in the
solution) and its activity along with the sample is recorded in channel A (let it be x 2
cpm). The increase in activity due to external γ -source (x 2 − x 1 cpm) is calculated.
Then required amount of the quencher is added to the sample and activity in channel
A is recorded, with (x i cpm) and without (y i cpm), in the presence of γ -source.
Finally, relative detection efficiency in channel A is calculated by equation given
below
v = f ×
Activity with quencher in channel A
Activity without quencher in channel B
= f
x i
y j
(6.3)
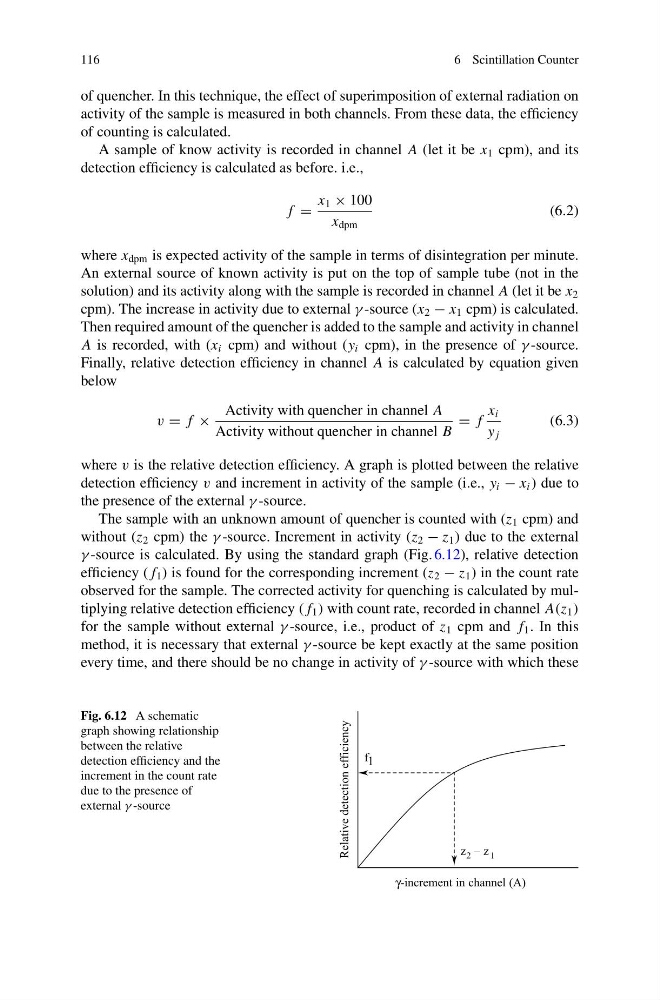
where v is the relative detection efficiency. A graph is plotted between the relative
detection efficiency v and increment in activity of the sample (i.e., y i − x i ) due to
the presence of the external γ -source.
The sample with an unknown amount of quencher is counted with (z 1 cpm) and
without (z 2 cpm) the γ -source. Increment in activity (z 2 − z 1 ) due to the external
γ -source is calculated. By using the standard graph (Fig. 6.12), relative detection
efficiency ( f 1 ) is found for the corresponding increment (z 2 − z 1 ) in the count rate
observed for the sample. The corrected activity for quenching is calculated by multiplying relative detection efficiency ( f 1 ) with count rate, recorded in channel A(z 1 )
for the sample without external γ -source, i.e., product of z 1 cpm and f 1 . In this
method, it is necessary that external γ -source be kept exactly at the same position
every time, and there should be no change in activity of γ -source with which these
Fig. 6.12 A schematic
graph showing relationship
between the relative
detection efficiency and the
increment in the count rate
due to the presence of
external γ -source
6 Scintillation Counter
of quencher. In this technique, the effect of superimposition of external radiation on
activity of the sample is measured in both channels. From these data, the efficiency
of counting is calculated.
A sample of know activity is recorded in channel A (let it be x 1 cpm), and its
detection efficiency is calculated as before. i.e.,
f =
x 1 × 100
x dpm
(6.2)
where x dpm is expected activity of the sample in terms of disintegration per minute.
An external source of known activity is put on the top of sample tube (not in the
solution) and its activity along with the sample is recorded in channel A (let it be x 2
cpm). The increase in activity due to external γ -source (x 2 − x 1 cpm) is calculated.
Then required amount of the quencher is added to the sample and activity in channel
A is recorded, with (x i cpm) and without (y i cpm), in the presence of γ -source.
Finally, relative detection efficiency in channel A is calculated by equation given
below
v = f ×
Activity with quencher in channel A
Activity without quencher in channel B
= f
x i
y j
(6.3)
where v is the relative detection efficiency. A graph is plotted between the relative
detection efficiency v and increment in activity of the sample (i.e., y i − x i ) due to
the presence of the external γ -source.
The sample with an unknown amount of quencher is counted with (z 1 cpm) and
without (z 2 cpm) the γ -source. Increment in activity (z 2 − z 1 ) due to the external
γ -source is calculated. By using the standard graph (Fig. 6.12), relative detection
efficiency ( f 1 ) is found for the corresponding increment (z 2 − z 1 ) in the count rate
observed for the sample. The corrected activity for quenching is calculated by multiplying relative detection efficiency ( f 1 ) with count rate, recorded in channel A(z 1 )
for the sample without external γ -source, i.e., product of z 1 cpm and f 1 . In this
method, it is necessary that external γ -source be kept exactly at the same position
every time, and there should be no change in activity of γ -source with which these
Fig. 6.12 A schematic
graph showing relationship
between the relative
detection efficiency and the
increment in the count rate
due to the presence of
external γ -source