

6.13 Quenching Corrections
115
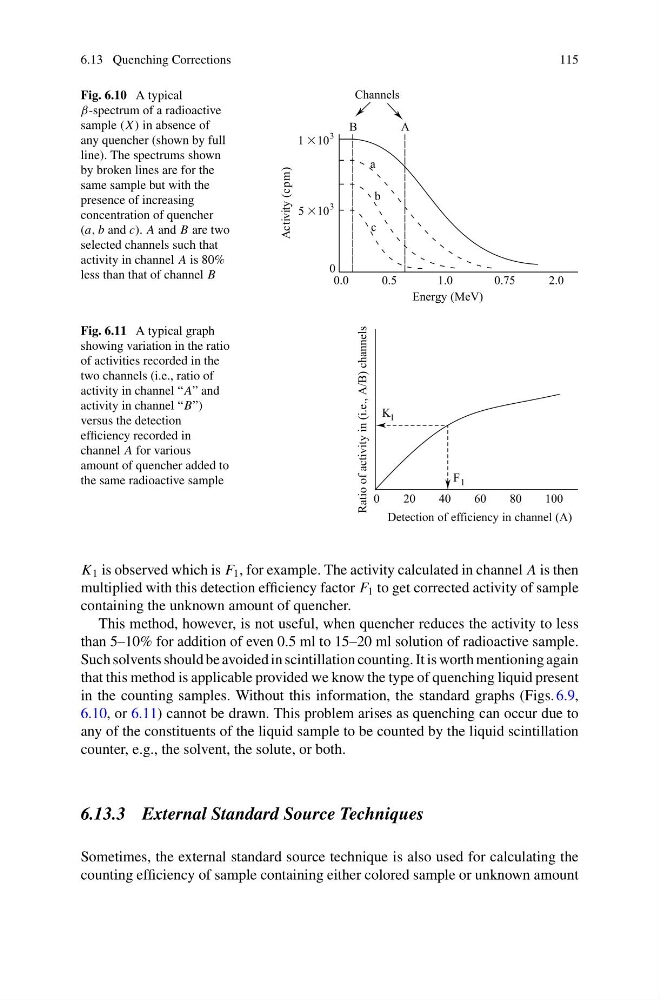
Fig. 6.10 A typical
β-spectrum of a radioactive
sample (X ) in absence of
any quencher (shown by full
line). The spectrums shown
by broken lines are for the
same sample but with the
presence of increasing
concentration of quencher
(a, b and c). A and B are two
selected channels such that
activity in channel A is 80%
less than that of channel B
Fig. 6.11 A typical graph
showing variation in the ratio
of activities recorded in the
two channels (i.e., ratio of
activity in channel “A” and
activity in channel “B”)
versus the detection
efficiency recorded in
channel A for various
amount of quencher added to
the same radioactive sample
K 1 is observed which is F 1 , for example. The activity calculated in channel A is then
multiplied with this detection efficiency factor F 1 to get corrected activity of sample
containing the unknown amount of quencher.
This method, however, is not useful, when quencher reduces the activity to less
than 5–10% for addition of even 0.5 ml to 15–20 ml solution of radioactive sample.
Such solvents should be avoided in scintillation counting. It is worth mentioning again
that this method is applicable provided we know the type of quenching liquid present
in the counting samples. Without this information, the standard graphs (Figs. 6.9,
6.10, or 6.11) cannot be drawn. This problem arises as quenching can occur due to
any of the constituents of the liquid sample to be counted by the liquid scintillation
counter, e.g., the solvent, the solute, or both.
6.13.3 External Standard Source Techniques
Sometimes, the external standard source technique is also used for calculating the
counting efficiency of sample containing either colored sample or unknown amount
115
Fig. 6.10 A typical
β-spectrum of a radioactive
sample (X ) in absence of
any quencher (shown by full
line). The spectrums shown
by broken lines are for the
same sample but with the
presence of increasing
concentration of quencher
(a, b and c). A and B are two
selected channels such that
activity in channel A is 80%
less than that of channel B
Fig. 6.11 A typical graph
showing variation in the ratio
of activities recorded in the
two channels (i.e., ratio of
activity in channel “A” and
activity in channel “B”)
versus the detection
efficiency recorded in
channel A for various
amount of quencher added to
the same radioactive sample
K 1 is observed which is F 1 , for example. The activity calculated in channel A is then
multiplied with this detection efficiency factor F 1 to get corrected activity of sample
containing the unknown amount of quencher.
This method, however, is not useful, when quencher reduces the activity to less
than 5–10% for addition of even 0.5 ml to 15–20 ml solution of radioactive sample.
Such solvents should be avoided in scintillation counting. It is worth mentioning again
that this method is applicable provided we know the type of quenching liquid present
in the counting samples. Without this information, the standard graphs (Figs. 6.9,
6.10, or 6.11) cannot be drawn. This problem arises as quenching can occur due to
any of the constituents of the liquid sample to be counted by the liquid scintillation
counter, e.g., the solvent, the solute, or both.
6.13.3 External Standard Source Techniques
Sometimes, the external standard source technique is also used for calculating the
counting efficiency of sample containing either colored sample or unknown amount