

6.13 Quenching Corrections
113
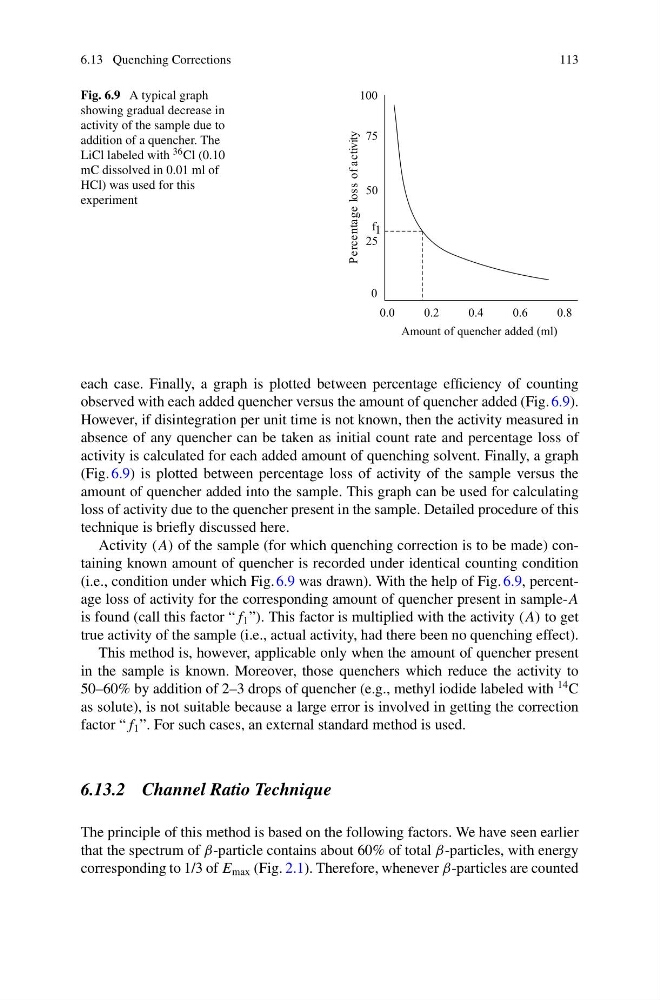
Fig. 6.9 A typical graph
showing gradual decrease in
activity of the sample due to
addition of a quencher. The
LiCl labeled with 36 Cl (0.10
mC dissolved in 0.01 ml of
HCl) was used for this
experiment
each case. Finally, a graph is plotted between percentage efficiency of counting
observed with each added quencher versus the amount of quencher added (Fig. 6.9).
However, if disintegration per unit time is not known, then the activity measured in
absence of any quencher can be taken as initial count rate and percentage loss of
activity is calculated for each added amount of quenching solvent. Finally, a graph
(Fig. 6.9) is plotted between percentage loss of activity of the sample versus the
amount of quencher added into the sample. This graph can be used for calculating
loss of activity due to the quencher present in the sample. Detailed procedure of this
technique is briefly discussed here.
Activity (A) of the sample (for which quenching correction is to be made) containing known amount of quencher is recorded under identical counting condition
(i.e., condition under which Fig. 6.9 was drawn). With the help of Fig. 6.9, percentage loss of activity for the corresponding amount of quencher present in sample-A
is found (call this factor “ f 1 ”). This factor is multiplied with the activity (A) to get
true activity of the sample (i.e., actual activity, had there been no quenching effect).
This method is, however, applicable only when the amount of quencher present
in the sample is known. Moreover, those quenchers which reduce the activity to
50–60% by addition of 2–3 drops of quencher (e.g., methyl iodide labeled with
14 C
as solute), is not suitable because a large error is involved in getting the correction
factor “ f 1 ”. For such cases, an external standard method is used.
6.13.2 Channel Ratio Technique
The principle of this method is based on the following factors. We have seen earlier
that the spectrum of β-particle contains about 60% of total β-particles, with energy
corresponding to 1/3 of E max (Fig. 2.1). Therefore, whenever β-particles are counted
113
Fig. 6.9 A typical graph
showing gradual decrease in
activity of the sample due to
addition of a quencher. The
LiCl labeled with 36 Cl (0.10
mC dissolved in 0.01 ml of
HCl) was used for this
experiment
each case. Finally, a graph is plotted between percentage efficiency of counting
observed with each added quencher versus the amount of quencher added (Fig. 6.9).
However, if disintegration per unit time is not known, then the activity measured in
absence of any quencher can be taken as initial count rate and percentage loss of
activity is calculated for each added amount of quenching solvent. Finally, a graph
(Fig. 6.9) is plotted between percentage loss of activity of the sample versus the
amount of quencher added into the sample. This graph can be used for calculating
loss of activity due to the quencher present in the sample. Detailed procedure of this
technique is briefly discussed here.
Activity (A) of the sample (for which quenching correction is to be made) containing known amount of quencher is recorded under identical counting condition
(i.e., condition under which Fig. 6.9 was drawn). With the help of Fig. 6.9, percentage loss of activity for the corresponding amount of quencher present in sample-A
is found (call this factor “ f 1 ”). This factor is multiplied with the activity (A) to get
true activity of the sample (i.e., actual activity, had there been no quenching effect).
This method is, however, applicable only when the amount of quencher present
in the sample is known. Moreover, those quenchers which reduce the activity to
50–60% by addition of 2–3 drops of quencher (e.g., methyl iodide labeled with
14 C
as solute), is not suitable because a large error is involved in getting the correction
factor “ f 1 ”. For such cases, an external standard method is used.
6.13.2 Channel Ratio Technique
The principle of this method is based on the following factors. We have seen earlier
that the spectrum of β-particle contains about 60% of total β-particles, with energy
corresponding to 1/3 of E max (Fig. 2.1). Therefore, whenever β-particles are counted