

6.11 Optimum Conditions for Counting
107
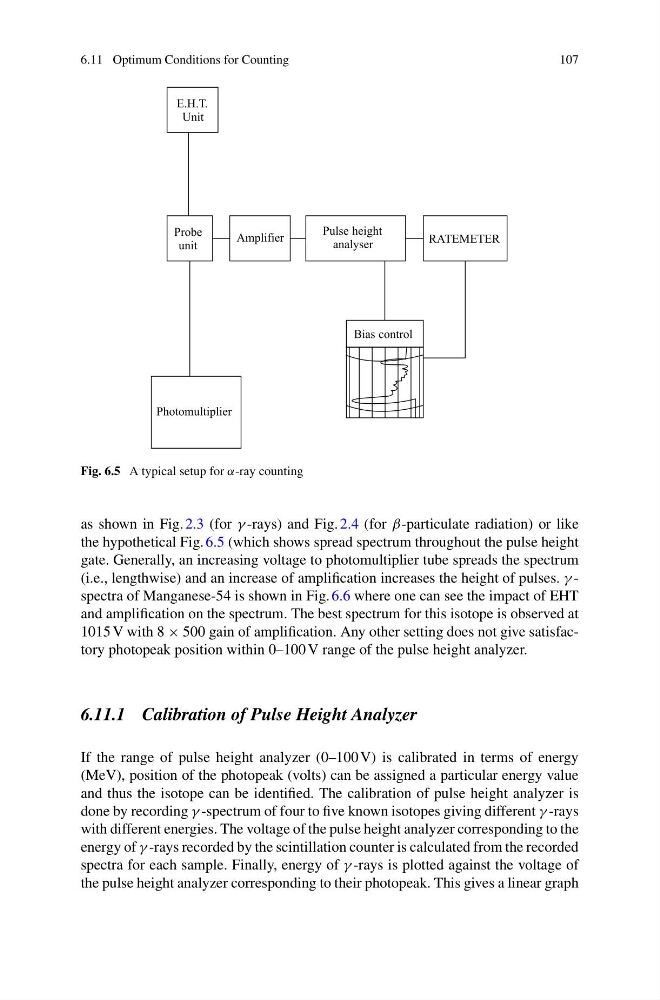
Fig. 6.5 A typical setup for α-ray counting
as shown in Fig. 2.3 (for γ -rays) and Fig. 2.4 (for β-particulate radiation) or like
the hypothetical Fig. 6.5 (which shows spread spectrum throughout the pulse height
gate. Generally, an increasing voltage to photomultiplier tube spreads the spectrum
(i.e., lengthwise) and an increase of amplification increases the height of pulses. γ -
spectra of Manganese-54 is shown in Fig. 6.6 where one can see the impact of EHT
and amplification on the spectrum. The best spectrum for this isotope is observed at
1015 V with 8 × 500 gain of amplification. Any other setting does not give satisfactory photopeak position within 0–100 V range of the pulse height analyzer.
6.11.1 Calibration of Pulse Height Analyzer
If the range of pulse height analyzer (0–100 V) is calibrated in terms of energy
(MeV), position of the photopeak (volts) can be assigned a particular energy value
and thus the isotope can be identified. The calibration of pulse height analyzer is
done by recording γ -spectrum of four to five known isotopes giving different γ -rays
with different energies. The voltage of the pulse height analyzer corresponding to the
energy of γ -rays recorded by the scintillation counter is calculated from the recorded
spectra for each sample. Finally, energy of γ -rays is plotted against the voltage of
the pulse height analyzer corresponding to their photopeak. This gives a linear graph
107
Fig. 6.5 A typical setup for α-ray counting
as shown in Fig. 2.3 (for γ -rays) and Fig. 2.4 (for β-particulate radiation) or like
the hypothetical Fig. 6.5 (which shows spread spectrum throughout the pulse height
gate. Generally, an increasing voltage to photomultiplier tube spreads the spectrum
(i.e., lengthwise) and an increase of amplification increases the height of pulses. γ -
spectra of Manganese-54 is shown in Fig. 6.6 where one can see the impact of EHT
and amplification on the spectrum. The best spectrum for this isotope is observed at
1015 V with 8 × 500 gain of amplification. Any other setting does not give satisfactory photopeak position within 0–100 V range of the pulse height analyzer.
6.11.1 Calibration of Pulse Height Analyzer
If the range of pulse height analyzer (0–100 V) is calibrated in terms of energy
(MeV), position of the photopeak (volts) can be assigned a particular energy value
and thus the isotope can be identified. The calibration of pulse height analyzer is
done by recording γ -spectrum of four to five known isotopes giving different γ -rays
with different energies. The voltage of the pulse height analyzer corresponding to the
energy of γ -rays recorded by the scintillation counter is calculated from the recorded
spectra for each sample. Finally, energy of γ -rays is plotted against the voltage of
the pulse height analyzer corresponding to their photopeak. This gives a linear graph