

3.3 Characterisation and Properties of PVA/BC Bionanocomposites
75
(b)
A4
B4
A4
B4
(a)
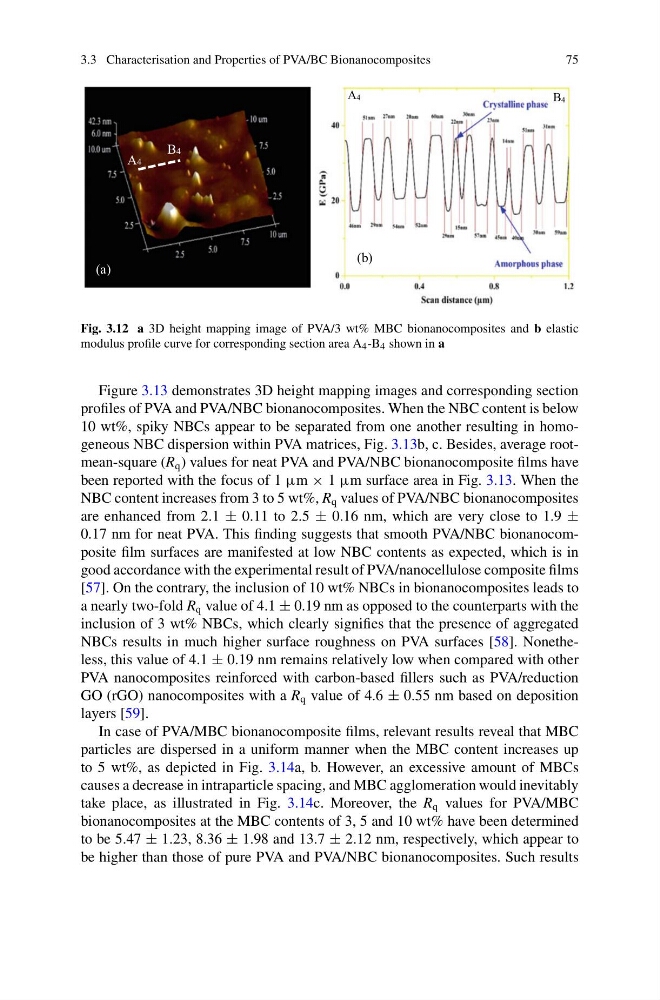
Fig. 3.12 a 3D height mapping image of PVA/3 wt% MBC bionanocomposites and b elastic
modulus profile curve for corresponding section area A 4 -B 4 shown in a
Figure 3.13 demonstrates 3D height mapping images and corresponding section
profiles of PVA and PVA/NBC bionanocomposites. When the NBC content is below
10 wt%, spiky NBCs appear to be separated from one another resulting in homogeneous NBC dispersion within PVA matrices, Fig. 3.13b, c. Besides, average rootmean-square (R q ) values for neat PVA and PVA/NBC bionanocomposite films have
been reported with the focus of 1 µm × 1 µm surface area in Fig. 3.13. When the
NBC content increases from 3 to 5 wt%, R q values of PVA/NBC bionanocomposites
are enhanced from 2.1 ± 0.11 to 2.5 ± 0.16 nm, which are very close to 1.9 ±
0.17 nm for neat PVA. This finding suggests that smooth PVA/NBC bionanocomposite film surfaces are manifested at low NBC contents as expected, which is in
good accordance with the experimental result of PVA/nanocellulose composite films
[57]. On the contrary, the inclusion of 10 wt% NBCs in bionanocomposites leads to
a nearly two-fold R q value of 4.1 ± 0.19 nm as opposed to the counterparts with the
inclusion of 3 wt% NBCs, which clearly signifies that the presence of aggregated
NBCs results in much higher surface roughness on PVA surfaces [58]. Nonetheless, this value of 4.1 ± 0.19 nm remains relatively low when compared with other
PVA nanocomposites reinforced with carbon-based fillers such as PVA/reduction
GO (rGO) nanocomposites with a R q value of 4.6 ± 0.55 nm based on deposition
layers [59].
In case of PVA/MBC bionanocomposite films, relevant results reveal that MBC
particles are dispersed in a uniform manner when the MBC content increases up
to 5 wt%, as depicted in Fig. 3.14a, b. However, an excessive amount of MBCs
causes a decrease in intraparticle spacing, and MBC agglomeration would inevitably
take place, as illustrated in Fig. 3.14c. Moreover, the R q values for PVA/MBC
bionanocomposites at the MBC contents of 3, 5 and 10 wt% have been determined
to be 5.47 ± 1.23, 8.36 ± 1.98 and 13.7 ± 2.12 nm, respectively, which appear to
be higher than those of pure PVA and PVA/NBC bionanocomposites. Such results
75
(b)
A4
B4
A4
B4
(a)
Fig. 3.12 a 3D height mapping image of PVA/3 wt% MBC bionanocomposites and b elastic
modulus profile curve for corresponding section area A 4 -B 4 shown in a
Figure 3.13 demonstrates 3D height mapping images and corresponding section
profiles of PVA and PVA/NBC bionanocomposites. When the NBC content is below
10 wt%, spiky NBCs appear to be separated from one another resulting in homogeneous NBC dispersion within PVA matrices, Fig. 3.13b, c. Besides, average rootmean-square (R q ) values for neat PVA and PVA/NBC bionanocomposite films have
been reported with the focus of 1 µm × 1 µm surface area in Fig. 3.13. When the
NBC content increases from 3 to 5 wt%, R q values of PVA/NBC bionanocomposites
are enhanced from 2.1 ± 0.11 to 2.5 ± 0.16 nm, which are very close to 1.9 ±
0.17 nm for neat PVA. This finding suggests that smooth PVA/NBC bionanocomposite film surfaces are manifested at low NBC contents as expected, which is in
good accordance with the experimental result of PVA/nanocellulose composite films
[57]. On the contrary, the inclusion of 10 wt% NBCs in bionanocomposites leads to
a nearly two-fold R q value of 4.1 ± 0.19 nm as opposed to the counterparts with the
inclusion of 3 wt% NBCs, which clearly signifies that the presence of aggregated
NBCs results in much higher surface roughness on PVA surfaces [58]. Nonetheless, this value of 4.1 ± 0.19 nm remains relatively low when compared with other
PVA nanocomposites reinforced with carbon-based fillers such as PVA/reduction
GO (rGO) nanocomposites with a R q value of 4.6 ± 0.55 nm based on deposition
layers [59].
In case of PVA/MBC bionanocomposite films, relevant results reveal that MBC
particles are dispersed in a uniform manner when the MBC content increases up
to 5 wt%, as depicted in Fig. 3.14a, b. However, an excessive amount of MBCs
causes a decrease in intraparticle spacing, and MBC agglomeration would inevitably
take place, as illustrated in Fig. 3.14c. Moreover, the R q values for PVA/MBC
bionanocomposites at the MBC contents of 3, 5 and 10 wt% have been determined
to be 5.47 ± 1.23, 8.36 ± 1.98 and 13.7 ± 2.12 nm, respectively, which appear to
be higher than those of pure PVA and PVA/NBC bionanocomposites. Such results