

70
3 PVA/BC Bionancomposite Films with Particle Size Effect
Table 3.3 Thermal properties of PVA/MBC bionanocomposites and PVA/NBC bionanocomposites
[27]
Sample
T g (°C) H m (J/g) χ c (%) T m (°C) T 5% (°C) T 80% (°C) T d (°C) T d
(°C)
PVA
65.19
50.8
36.65 222.91 200.15
363.5
274.23
PVA/MBC/3
wt%
68.62
50.6
37.63 223.43 256.22
383.3
281.81
PVA/MBC/5
wt%
69.89
50.1
38.04 224.37 258.78
410.12
288.93
PVA/MBC/10
wt%
73.66
49.91
40
224.93 265.9
428.03
305.43 325.03
PVA/NBC/3
wt%
70.53
50.01
37.21 222.12 256.3
390.67
278.48
PVA/NBC/5
wt%
73.46
49.77
37.83 221.57 262.96
440.28
283.4
303.77
PVA/NBC/10
wt%
75.06
48.16
38.6
222.63 270.73
464.03
294.61 324.12
Note T g , ΔH m , χ c and T m are glass transition temperature, melting enthalpy, degree of crystallinity
and melting temperature determined in DSC analysis, respectively. T 5% , T 80% , T d and T d are the
temperatures at the mass losses of 5 and 80%, as well as the first and second maximum decomposition
temperatures in TGA accordingly
increase in the T g of PVA from 70 to 73 °C with the addition of 2 phr selective reduced
GOs (SRGOs). Moreover, 10 wt% MWNTs were found to enhance the T g of PVA by
4.8 °C in PVA/MWNT nanocomposites [41]. The strong hydrogen bonding between
BC particles and PVA matrices also plays an important role in restricting the free
movement and arrangement of PVA molecular chains with the required higher T g , in
good accordance with PVA/GO nanocomposites [42]. Relatively high T g values of
PVA/NBC bionanocomposites are ascribed to higher surface areas of NBCs (relative
to those of MBCs), resulting in the increase in volume fraction of interfacial areas to
further constrain the chain mobility of PVA matrices [43]. The melting temperature of
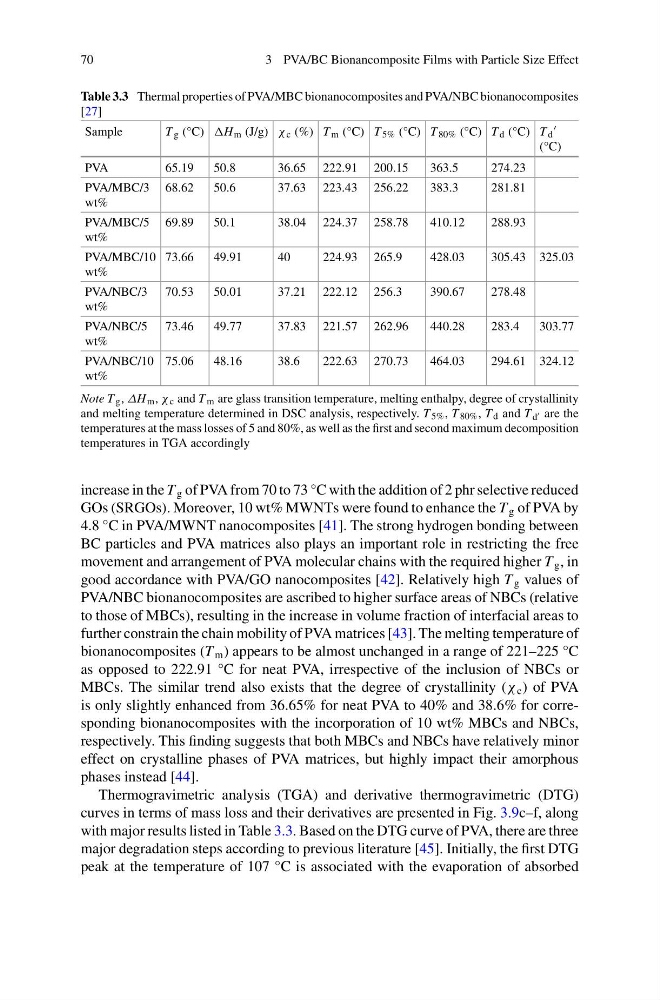
bionanocomposites (T m ) appears to be almost unchanged in a range of 221–225 °C
as opposed to 222.91 °C for neat PVA, irrespective of the inclusion of NBCs or
MBCs. The similar trend also exists that the degree of crystallinity (χ c ) of PVA
is only slightly enhanced from 36.65% for neat PVA to 40% and 38.6% for corresponding bionanocomposites with the incorporation of 10 wt% MBCs and NBCs,
respectively. This finding suggests that both MBCs and NBCs have relatively minor
effect on crystalline phases of PVA matrices, but highly impact their amorphous
phases instead [44].
Thermogravimetric analysis (TGA) and derivative thermogravimetric (DTG)
curves in terms of mass loss and their derivatives are presented in Fig. 3.9c–f, along
with major results listed in Table 3.3. Based on the DTG curve of PVA, there are three
major degradation steps according to previous literature [45]. Initially, the first DTG
peak at the temperature of 107 °C is associated with the evaporation of absorbed
3 PVA/BC Bionancomposite Films with Particle Size Effect
Table 3.3 Thermal properties of PVA/MBC bionanocomposites and PVA/NBC bionanocomposites
[27]
Sample
T g (°C) H m (J/g) χ c (%) T m (°C) T 5% (°C) T 80% (°C) T d (°C) T d
(°C)
PVA
65.19
50.8
36.65 222.91 200.15
363.5
274.23
PVA/MBC/3
wt%
68.62
50.6
37.63 223.43 256.22
383.3
281.81
PVA/MBC/5
wt%
69.89
50.1
38.04 224.37 258.78
410.12
288.93
PVA/MBC/10
wt%
73.66
49.91
40
224.93 265.9
428.03
305.43 325.03
PVA/NBC/3
wt%
70.53
50.01
37.21 222.12 256.3
390.67
278.48
PVA/NBC/5
wt%
73.46
49.77
37.83 221.57 262.96
440.28
283.4
303.77
PVA/NBC/10
wt%
75.06
48.16
38.6
222.63 270.73
464.03
294.61 324.12
Note T g , ΔH m , χ c and T m are glass transition temperature, melting enthalpy, degree of crystallinity
and melting temperature determined in DSC analysis, respectively. T 5% , T 80% , T d and T d are the
temperatures at the mass losses of 5 and 80%, as well as the first and second maximum decomposition
temperatures in TGA accordingly
increase in the T g of PVA from 70 to 73 °C with the addition of 2 phr selective reduced
GOs (SRGOs). Moreover, 10 wt% MWNTs were found to enhance the T g of PVA by
4.8 °C in PVA/MWNT nanocomposites [41]. The strong hydrogen bonding between
BC particles and PVA matrices also plays an important role in restricting the free
movement and arrangement of PVA molecular chains with the required higher T g , in
good accordance with PVA/GO nanocomposites [42]. Relatively high T g values of
PVA/NBC bionanocomposites are ascribed to higher surface areas of NBCs (relative
to those of MBCs), resulting in the increase in volume fraction of interfacial areas to
further constrain the chain mobility of PVA matrices [43]. The melting temperature of
bionanocomposites (T m ) appears to be almost unchanged in a range of 221–225 °C
as opposed to 222.91 °C for neat PVA, irrespective of the inclusion of NBCs or
MBCs. The similar trend also exists that the degree of crystallinity (χ c ) of PVA
is only slightly enhanced from 36.65% for neat PVA to 40% and 38.6% for corresponding bionanocomposites with the incorporation of 10 wt% MBCs and NBCs,
respectively. This finding suggests that both MBCs and NBCs have relatively minor
effect on crystalline phases of PVA matrices, but highly impact their amorphous
phases instead [44].
Thermogravimetric analysis (TGA) and derivative thermogravimetric (DTG)
curves in terms of mass loss and their derivatives are presented in Fig. 3.9c–f, along
with major results listed in Table 3.3. Based on the DTG curve of PVA, there are three
major degradation steps according to previous literature [45]. Initially, the first DTG
peak at the temperature of 107 °C is associated with the evaporation of absorbed