

3.3 Characterisation and Properties of PVA/BC Bionanocomposites
69
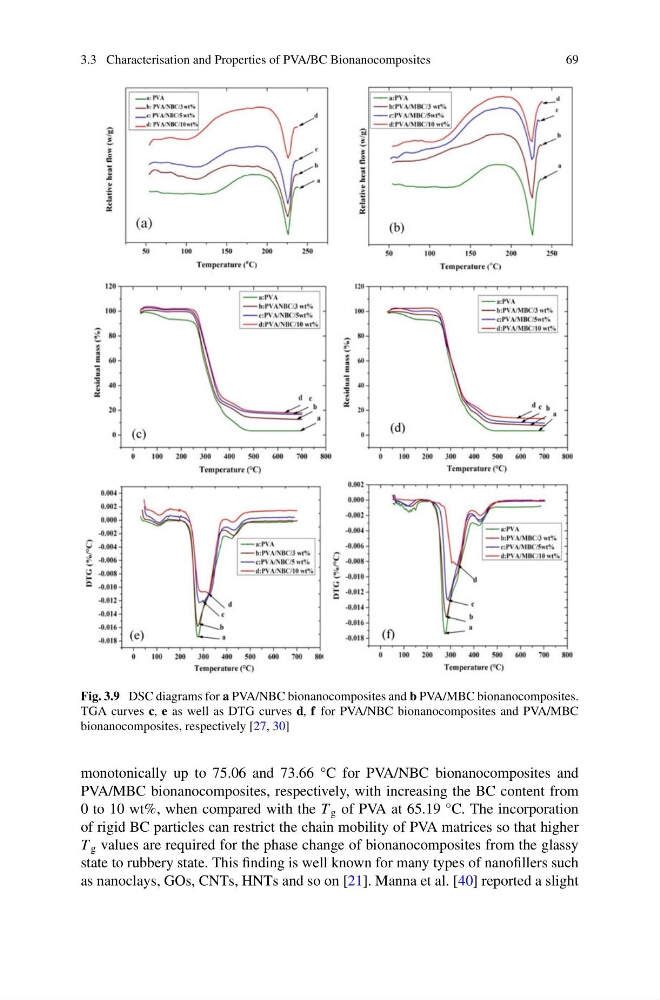
Fig. 3.9 DSC diagrams for a PVA/NBC bionanocomposites and b PVA/MBC bionanocomposites.
TGA curves c, e as well as DTG curves d, f for PVA/NBC bionanocomposites and PVA/MBC
bionanocomposites, respectively [27, 30]
monotonically up to 75.06 and 73.66 °C for PVA/NBC bionanocomposites and
PVA/MBC bionanocomposites, respectively, with increasing the BC content from
0 to 10 wt%, when compared with the T g of PVA at 65.19 °C. The incorporation
of rigid BC particles can restrict the chain mobility of PVA matrices so that higher
T g values are required for the phase change of bionanocomposites from the glassy
state to rubbery state. This finding is well known for many types of nanofillers such
as nanoclays, GOs, CNTs, HNTs and so on [21]. Manna et al. [40] reported a slight
69
Fig. 3.9 DSC diagrams for a PVA/NBC bionanocomposites and b PVA/MBC bionanocomposites.
TGA curves c, e as well as DTG curves d, f for PVA/NBC bionanocomposites and PVA/MBC
bionanocomposites, respectively [27, 30]
monotonically up to 75.06 and 73.66 °C for PVA/NBC bionanocomposites and
PVA/MBC bionanocomposites, respectively, with increasing the BC content from
0 to 10 wt%, when compared with the T g of PVA at 65.19 °C. The incorporation
of rigid BC particles can restrict the chain mobility of PVA matrices so that higher
T g values are required for the phase change of bionanocomposites from the glassy
state to rubbery state. This finding is well known for many types of nanofillers such
as nanoclays, GOs, CNTs, HNTs and so on [21]. Manna et al. [40] reported a slight