

3.3 Characterisation and Properties of PVA/BC Bionanocomposites
63
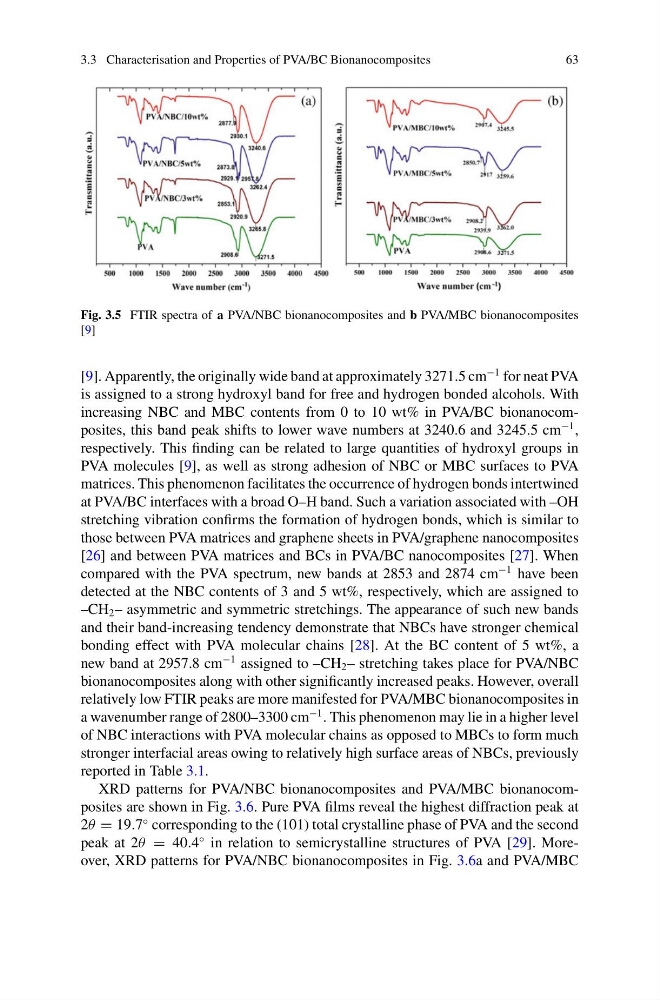
Fig. 3.5 FTIR spectra of a PVA/NBC bionanocomposites and b PVA/MBC bionanocomposites
[9]
[9]. Apparently, the originally wide band at approximately 3271.5 cm
−1 for neat PVA
is assigned to a strong hydroxyl band for free and hydrogen bonded alcohols. With
increasing NBC and MBC contents from 0 to 10 wt% in PVA/BC bionanocomposites, this band peak shifts to lower wave numbers at 3240.6 and 3245.5 cm
−1 ,
respectively. This finding can be related to large quantities of hydroxyl groups in
PVA molecules [9], as well as strong adhesion of NBC or MBC surfaces to PVA
matrices. This phenomenon facilitates the occurrence of hydrogen bonds intertwined
at PVA/BC interfaces with a broad O–H band. Such a variation associated with –OH
stretching vibration confirms the formation of hydrogen bonds, which is similar to
those between PVA matrices and graphene sheets in PVA/graphene nanocomposites
[26] and between PVA matrices and BCs in PVA/BC nanocomposites [27]. When
compared with the PVA spectrum, new bands at 2853 and 2874 cm
−1 have been
detected at the NBC contents of 3 and 5 wt%, respectively, which are assigned to
–CH 2 – asymmetric and symmetric stretchings. The appearance of such new bands
and their band-increasing tendency demonstrate that NBCs have stronger chemical
bonding effect with PVA molecular chains [28]. At the BC content of 5 wt%, a
new band at 2957.8 cm
−1 assigned to –CH 2 – stretching takes place for PVA/NBC
bionanocomposites along with other significantly increased peaks. However, overall
relatively low FTIR peaks are more manifested for PVA/MBC bionanocomposites in
a wavenumber range of 2800–3300 cm
−1 . This phenomenon may lie in a higher level
of NBC interactions with PVA molecular chains as opposed to MBCs to form much
stronger interfacial areas owing to relatively high surface areas of NBCs, previously
reported in Table 3.1.
XRD patterns for PVA/NBC bionanocomposites and PVA/MBC bionanocomposites are shown in Fig. 3.6. Pure PVA films reveal the highest diffraction peak at
2θ = 19.7
◦ corresponding to the (101) total crystalline phase of PVA and the second
peak at 2θ = 40.4
◦ in relation to semicrystalline structures of PVA [29]. Moreover, XRD patterns for PVA/NBC bionanocomposites in Fig. 3.6a and PVA/MBC
63
Fig. 3.5 FTIR spectra of a PVA/NBC bionanocomposites and b PVA/MBC bionanocomposites
[9]
[9]. Apparently, the originally wide band at approximately 3271.5 cm
−1 for neat PVA
is assigned to a strong hydroxyl band for free and hydrogen bonded alcohols. With
increasing NBC and MBC contents from 0 to 10 wt% in PVA/BC bionanocomposites, this band peak shifts to lower wave numbers at 3240.6 and 3245.5 cm
−1 ,
respectively. This finding can be related to large quantities of hydroxyl groups in
PVA molecules [9], as well as strong adhesion of NBC or MBC surfaces to PVA
matrices. This phenomenon facilitates the occurrence of hydrogen bonds intertwined
at PVA/BC interfaces with a broad O–H band. Such a variation associated with –OH
stretching vibration confirms the formation of hydrogen bonds, which is similar to
those between PVA matrices and graphene sheets in PVA/graphene nanocomposites
[26] and between PVA matrices and BCs in PVA/BC nanocomposites [27]. When
compared with the PVA spectrum, new bands at 2853 and 2874 cm
−1 have been
detected at the NBC contents of 3 and 5 wt%, respectively, which are assigned to
–CH 2 – asymmetric and symmetric stretchings. The appearance of such new bands
and their band-increasing tendency demonstrate that NBCs have stronger chemical
bonding effect with PVA molecular chains [28]. At the BC content of 5 wt%, a
new band at 2957.8 cm
−1 assigned to –CH 2 – stretching takes place for PVA/NBC
bionanocomposites along with other significantly increased peaks. However, overall
relatively low FTIR peaks are more manifested for PVA/MBC bionanocomposites in
a wavenumber range of 2800–3300 cm
−1 . This phenomenon may lie in a higher level
of NBC interactions with PVA molecular chains as opposed to MBCs to form much
stronger interfacial areas owing to relatively high surface areas of NBCs, previously
reported in Table 3.1.
XRD patterns for PVA/NBC bionanocomposites and PVA/MBC bionanocomposites are shown in Fig. 3.6. Pure PVA films reveal the highest diffraction peak at
2θ = 19.7
◦ corresponding to the (101) total crystalline phase of PVA and the second
peak at 2θ = 40.4
◦ in relation to semicrystalline structures of PVA [29]. Moreover, XRD patterns for PVA/NBC bionanocomposites in Fig. 3.6a and PVA/MBC