

3.2 BC Particle Characterisation
61
(a)
(b)
(c)
(d)
(e)
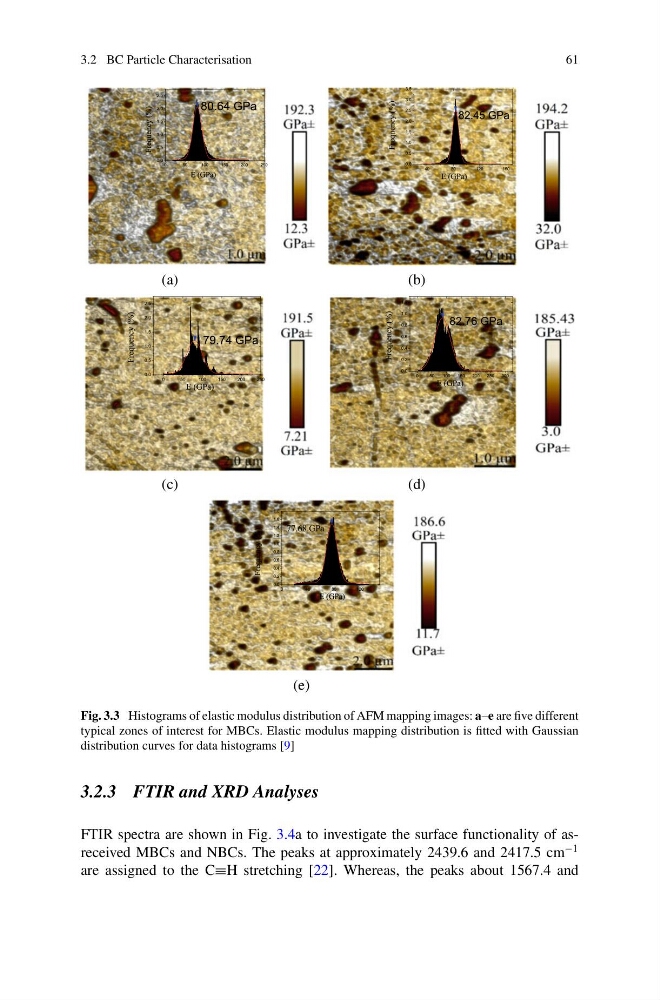
Fig. 3.3 Histograms of elastic modulus distribution of AFM mapping images: a–e are five different
typical zones of interest for MBCs. Elastic modulus mapping distribution is fitted with Gaussian
distribution curves for data histograms [9]
3.2.3 FTIR and XRD Analyses
FTIR spectra are shown in Fig. 3.4a to investigate the surface functionality of asreceived MBCs and NBCs. The peaks at approximately 2439.6 and 2417.5 cm
−1
are assigned to the C≡H stretching [22]. Whereas, the peaks about 1567.4 and
61
(a)
(b)
(c)
(d)
(e)
Fig. 3.3 Histograms of elastic modulus distribution of AFM mapping images: a–e are five different
typical zones of interest for MBCs. Elastic modulus mapping distribution is fitted with Gaussian
distribution curves for data histograms [9]
3.2.3 FTIR and XRD Analyses
FTIR spectra are shown in Fig. 3.4a to investigate the surface functionality of asreceived MBCs and NBCs. The peaks at approximately 2439.6 and 2417.5 cm
−1
are assigned to the C≡H stretching [22]. Whereas, the peaks about 1567.4 and