

52
2 Materials, Methodology and Characterisation Techniques
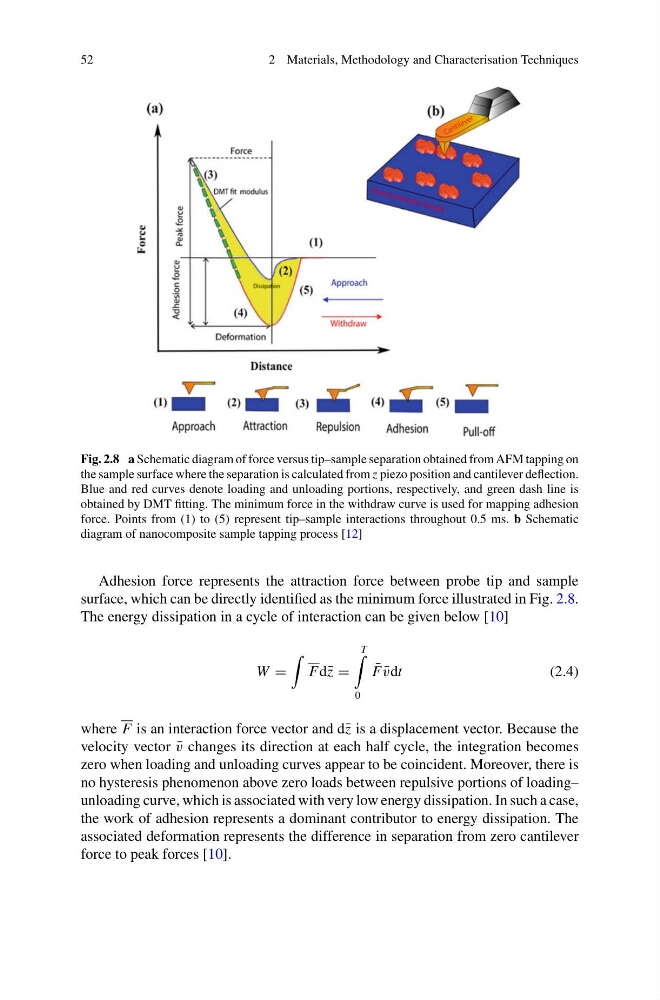
Fig. 2.8 a Schematic diagram of force versus tip–sample separation obtained from AFM tapping on
the sample surface where the separation is calculated from z piezo position and cantilever deflection.
Blue and red curves denote loading and unloading portions, respectively, and green dash line is
obtained by DMT fitting. The minimum force in the withdraw curve is used for mapping adhesion
force. Points from (1) to (5) represent tip–sample interactions throughout 0.5 ms. b Schematic
diagram of nanocomposite sample tapping process [12]
Adhesion force represents the attraction force between probe tip and sample
surface, which can be directly identified as the minimum force illustrated in Fig. 2.8.
The energy dissipation in a cycle of interaction can be given below [10]
W =
Fd¯ z =
T
0
¯
F ¯
vdt
(2.4)
where F is an interaction force vector and d¯ z is a displacement vector. Because the
velocity vector ¯
v changes its direction at each half cycle, the integration becomes
zero when loading and unloading curves appear to be coincident. Moreover, there is
no hysteresis phenomenon above zero loads between repulsive portions of loading–
unloading curve, which is associated with very low energy dissipation. In such a case,
the work of adhesion represents a dominant contributor to energy dissipation. The
associated deformation represents the difference in separation from zero cantilever
force to peak forces [10].
2 Materials, Methodology and Characterisation Techniques
Fig. 2.8 a Schematic diagram of force versus tip–sample separation obtained from AFM tapping on
the sample surface where the separation is calculated from z piezo position and cantilever deflection.
Blue and red curves denote loading and unloading portions, respectively, and green dash line is
obtained by DMT fitting. The minimum force in the withdraw curve is used for mapping adhesion
force. Points from (1) to (5) represent tip–sample interactions throughout 0.5 ms. b Schematic
diagram of nanocomposite sample tapping process [12]
Adhesion force represents the attraction force between probe tip and sample
surface, which can be directly identified as the minimum force illustrated in Fig. 2.8.
The energy dissipation in a cycle of interaction can be given below [10]
W =
Fd¯ z =
T
0
¯
F ¯
vdt
(2.4)
where F is an interaction force vector and d¯ z is a displacement vector. Because the
velocity vector ¯
v changes its direction at each half cycle, the integration becomes
zero when loading and unloading curves appear to be coincident. Moreover, there is
no hysteresis phenomenon above zero loads between repulsive portions of loading–
unloading curve, which is associated with very low energy dissipation. In such a case,
the work of adhesion represents a dominant contributor to energy dissipation. The
associated deformation represents the difference in separation from zero cantilever
force to peak forces [10].