

50
2 Materials, Methodology and Characterisation Techniques
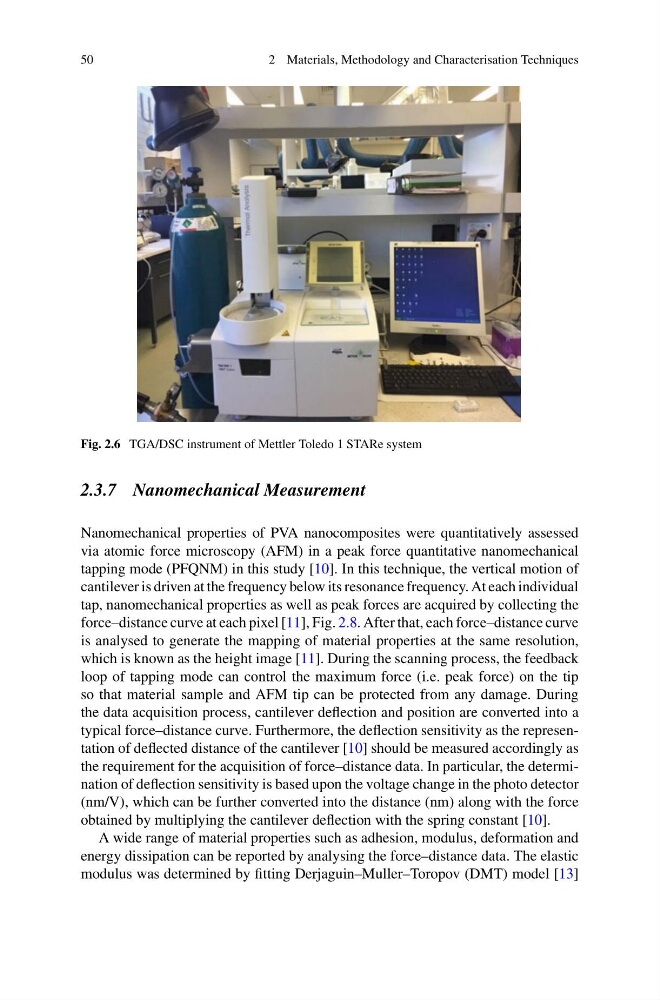
Fig. 2.6 TGA/DSC instrument of Mettler Toledo 1 STARe system
2.3.7 Nanomechanical Measurement
Nanomechanical properties of PVA nanocomposites were quantitatively assessed
via atomic force microscopy (AFM) in a peak force quantitative nanomechanical
tapping mode (PFQNM) in this study [10]. In this technique, the vertical motion of
cantilever is driven at the frequency below its resonance frequency. At each individual
tap, nanomechanical properties as well as peak forces are acquired by collecting the
force–distance curve at each pixel [11], Fig. 2.8. After that, each force–distance curve
is analysed to generate the mapping of material properties at the same resolution,
which is known as the height image [11]. During the scanning process, the feedback
loop of tapping mode can control the maximum force (i.e. peak force) on the tip
so that material sample and AFM tip can be protected from any damage. During
the data acquisition process, cantilever deflection and position are converted into a
typical force–distance curve. Furthermore, the deflection sensitivity as the representation of deflected distance of the cantilever [10] should be measured accordingly as
the requirement for the acquisition of force–distance data. In particular, the determination of deflection sensitivity is based upon the voltage change in the photo detector
(nm/V), which can be further converted into the distance (nm) along with the force
obtained by multiplying the cantilever deflection with the spring constant [10].
A wide range of material properties such as adhesion, modulus, deformation and
energy dissipation can be reported by analysing the force–distance data. The elastic
modulus was determined by fitting Derjaguin–Muller–Toropov (DMT) model [13]
2 Materials, Methodology and Characterisation Techniques
Fig. 2.6 TGA/DSC instrument of Mettler Toledo 1 STARe system
2.3.7 Nanomechanical Measurement
Nanomechanical properties of PVA nanocomposites were quantitatively assessed
via atomic force microscopy (AFM) in a peak force quantitative nanomechanical
tapping mode (PFQNM) in this study [10]. In this technique, the vertical motion of
cantilever is driven at the frequency below its resonance frequency. At each individual
tap, nanomechanical properties as well as peak forces are acquired by collecting the
force–distance curve at each pixel [11], Fig. 2.8. After that, each force–distance curve
is analysed to generate the mapping of material properties at the same resolution,
which is known as the height image [11]. During the scanning process, the feedback
loop of tapping mode can control the maximum force (i.e. peak force) on the tip
so that material sample and AFM tip can be protected from any damage. During
the data acquisition process, cantilever deflection and position are converted into a
typical force–distance curve. Furthermore, the deflection sensitivity as the representation of deflected distance of the cantilever [10] should be measured accordingly as
the requirement for the acquisition of force–distance data. In particular, the determination of deflection sensitivity is based upon the voltage change in the photo detector
(nm/V), which can be further converted into the distance (nm) along with the force
obtained by multiplying the cantilever deflection with the spring constant [10].
A wide range of material properties such as adhesion, modulus, deformation and
energy dissipation can be reported by analysing the force–distance data. The elastic
modulus was determined by fitting Derjaguin–Muller–Toropov (DMT) model [13]