

172
Appendix: Interphase Dimension Measurement Via AFM
Lj HNT
Lj Interphase
A
B
A
B
Interphases
tLj2
tLj1
HNT 10 nm
tHk1
tHk2
DLk HNT
Hk Interphase
jth plane
kth plane
(b)
(a)
HNT
Interphase
4 nm
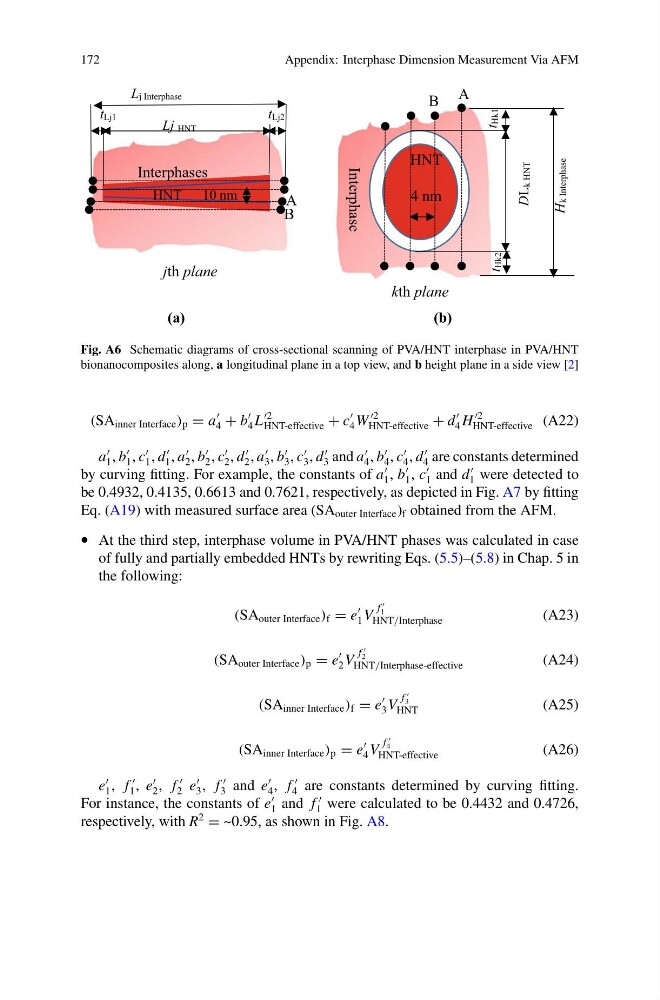
Fig. A6 Schematic diagrams of cross-sectional scanning of PVA/HNT interphase in PVA/HNT
bionanocomposites along, a longitudinal plane in a top view, and b height plane in a side view [2]
(SA inner Interface ) p = a
4 + b
4 L
2
HNT-effective + c
4 W
HNT-effective + d
4 H
HNT-effective (A22)
a
1 , b
1 , c
1 , d
1 , a
2 , b
2 , c
2 , d
2 , a
3 , b
3 , c
3 , d
3 and a
4 , b
4 , c
4 , d
4 are constants determined
by curving fitting. For example, the constants of a
1 , b
1 , c
1 and d
1 were detected to
be 0.4932, 0.4135, 0.6613 and 0.7621, respectively, as depicted in Fig. A7 by fitting
Eq. (A19) with measured surface area (SA outer Interface ) f obtained from the AFM.
• At the third step, interphase volume in PVA/HNT phases was calculated in case
of fully and partially embedded HNTs by rewriting Eqs. (5.5)–(5.8) in Chap. 5 in
the following:
(SA outer Interface ) f = e
1 V
f
1
HNT/Interphase
(A23)
(SA outer Interface ) p = e
2 V
f
2
HNT/Interphase-effective
(A24)
(SA inner Interface ) f = e
3 V
f
3
HNT
(A25)
(SA inner Interface ) p = e
4 V
f
4
HNT-effective
(A26)
e
1 , f
1 , e
2 , f
2 e
3 , f
3 and e
4 , f
4 are constants determined by curving fitting.
For instance, the constants of e
1 and f
1 were calculated to be 0.4432 and 0.4726,
respectively, with R
2
= ~0.95, as shown in Fig. A8.
Appendix: Interphase Dimension Measurement Via AFM
Lj HNT
Lj Interphase
A
B
A
B
Interphases
tLj2
tLj1
HNT 10 nm
tHk1
tHk2
DLk HNT
Hk Interphase
jth plane
kth plane
(b)
(a)
HNT
Interphase
4 nm
Fig. A6 Schematic diagrams of cross-sectional scanning of PVA/HNT interphase in PVA/HNT
bionanocomposites along, a longitudinal plane in a top view, and b height plane in a side view [2]
(SA inner Interface ) p = a
4 + b
4 L
2
HNT-effective + c
4 W
HNT-effective + d
4 H
HNT-effective (A22)
a
1 , b
1 , c
1 , d
1 , a
2 , b
2 , c
2 , d
2 , a
3 , b
3 , c
3 , d
3 and a
4 , b
4 , c
4 , d
4 are constants determined
by curving fitting. For example, the constants of a
1 , b
1 , c
1 and d
1 were detected to
be 0.4932, 0.4135, 0.6613 and 0.7621, respectively, as depicted in Fig. A7 by fitting
Eq. (A19) with measured surface area (SA outer Interface ) f obtained from the AFM.
• At the third step, interphase volume in PVA/HNT phases was calculated in case
of fully and partially embedded HNTs by rewriting Eqs. (5.5)–(5.8) in Chap. 5 in
the following:
(SA outer Interface ) f = e
1 V
f
1
HNT/Interphase
(A23)
(SA outer Interface ) p = e
2 V
f
2
HNT/Interphase-effective
(A24)
(SA inner Interface ) f = e
3 V
f
3
HNT
(A25)
(SA inner Interface ) p = e
4 V
f
4
HNT-effective
(A26)
e
1 , f
1 , e
2 , f
2 e
3 , f
3 and e
4 , f
4 are constants determined by curving fitting.
For instance, the constants of e
1 and f
1 were calculated to be 0.4432 and 0.4726,
respectively, with R
2
= ~0.95, as shown in Fig. A8.