

122
5 3D Interphase of PVA Bionanocomposite Films
(c)
(a)
B19
A19
(d)
A19
(e)
Partially embedded
HNT
Partially embedded
HNT
Fully embedded
HNT
Fully embedded
HNT
(b)
B19
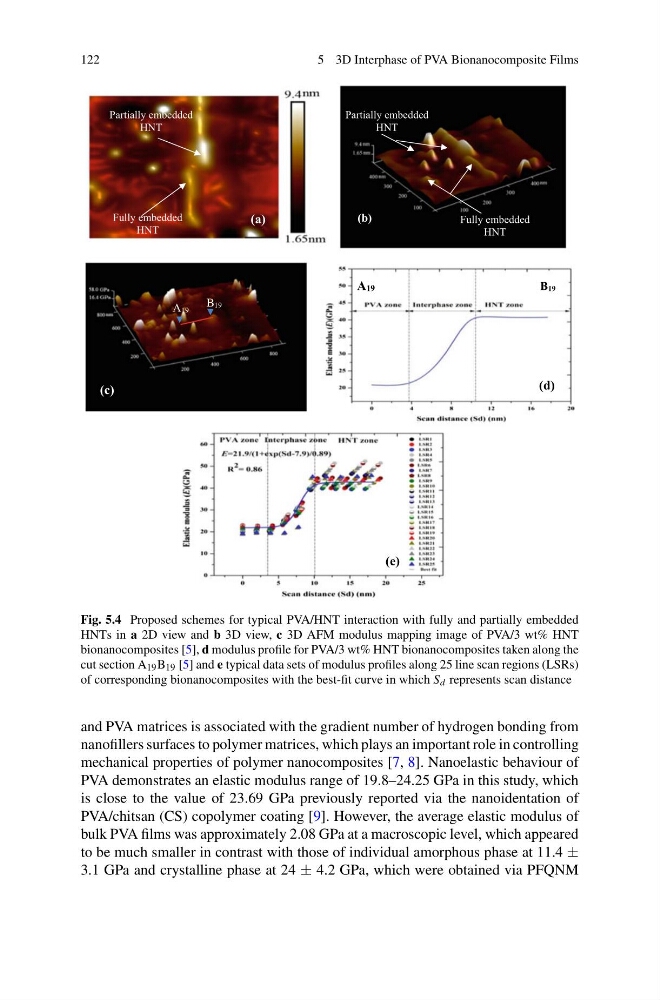
Fig. 5.4 Proposed schemes for typical PVA/HNT interaction with fully and partially embedded
HNTs in a 2D view and b 3D view, c 3D AFM modulus mapping image of PVA/3 wt% HNT
bionanocomposites [5], d modulus profile for PVA/3 wt% HNT bionanocomposites taken along the
cut section A 19 B 19 [5] and e typical data sets of modulus profiles along 25 line scan regions (LSRs)
of corresponding bionanocomposites with the best-fit curve in which S d represents scan distance
and PVA matrices is associated with the gradient number of hydrogen bonding from
nanofillers surfaces to polymer matrices, which plays an important role in controlling
mechanical properties of polymer nanocomposites [7, 8]. Nanoelastic behaviour of
PVA demonstrates an elastic modulus range of 19.8–24.25 GPa in this study, which
is close to the value of 23.69 GPa previously reported via the nanoidentation of
PVA/chitsan (CS) copolymer coating [9]. However, the average elastic modulus of
bulk PVA films was approximately 2.08 GPa at a macroscopic level, which appeared
to be much smaller in contrast with those of individual amorphous phase at 11.4 ±
3.1 GPa and crystalline phase at 24 ± 4.2 GPa, which were obtained via PFQNM
5 3D Interphase of PVA Bionanocomposite Films
(c)
(a)
B19
A19
(d)
A19
(e)
Partially embedded
HNT
Partially embedded
HNT
Fully embedded
HNT
Fully embedded
HNT
(b)
B19
Fig. 5.4 Proposed schemes for typical PVA/HNT interaction with fully and partially embedded
HNTs in a 2D view and b 3D view, c 3D AFM modulus mapping image of PVA/3 wt% HNT
bionanocomposites [5], d modulus profile for PVA/3 wt% HNT bionanocomposites taken along the
cut section A 19 B 19 [5] and e typical data sets of modulus profiles along 25 line scan regions (LSRs)
of corresponding bionanocomposites with the best-fit curve in which S d represents scan distance
and PVA matrices is associated with the gradient number of hydrogen bonding from
nanofillers surfaces to polymer matrices, which plays an important role in controlling
mechanical properties of polymer nanocomposites [7, 8]. Nanoelastic behaviour of
PVA demonstrates an elastic modulus range of 19.8–24.25 GPa in this study, which
is close to the value of 23.69 GPa previously reported via the nanoidentation of
PVA/chitsan (CS) copolymer coating [9]. However, the average elastic modulus of
bulk PVA films was approximately 2.08 GPa at a macroscopic level, which appeared
to be much smaller in contrast with those of individual amorphous phase at 11.4 ±
3.1 GPa and crystalline phase at 24 ± 4.2 GPa, which were obtained via PFQNM