

4. Electrophorese the loaded agarose gel at 100 V for 30 min.
5. After electrophoresis, capture DNA gel images (Fig. 1).
6. Quantify all data from gel images by the Quantity One 1-D
analysis software (see Note 5). The mobility of L5a/DNA
complexes should decrease compared to DNA alone, indicating the formation of noncovalent binding between L5a and
DNA (see Note 6).
3.2 Fluorescent
Image Studies of L5a/
DNA Complexes in
Cellular Uptake
To determine the transfection ability of L5a, L5a/DNA complexes
prepared at an N/P ratio of 12 (see Note 7) are incubated with cells.
Fluorescent microscopy is then used to detect the EGFP reporter
gene expression of the pEGFP-N1 plasmid delivered by L5a at the
protein level.
3.2.1 Cellular Delivery of
L5a/DNA Complexes
1. Adherent cell culture: Seed 1 Â 10
5 A549 cells (or other mammalian cell lines) into 35-mm tissue culture dishes and place
dishes in a humidified 5% CO 2 incubator at 37
C overnight to
allow cells to adhere to the dishes (see Note 8).
2. Mix L5a with the pEGFP-N1 plasmid at an N/P ¼ 12 in RPMI
1640 medium without serum (see Note 9). Combine 20 μL
L5a (720 nmol), 74 μL DNA (60 nmol), and 106 μL RPMI
1640 medium to make a final volume of 200 μL of complexes.
3. Incubate L5a/DNA complexes at 37
C for 1 h.
4. Discard the overnight culture medium. Wash cells with 1 mL
PBS once.
5. Add L5a/DNA complexes to the cells and incubate dishes at
37
C for 1 h.
6. After treatment, wash cells with 1 mL PBS once and incubate
dishes at 37
C for an additional 24–48 h.
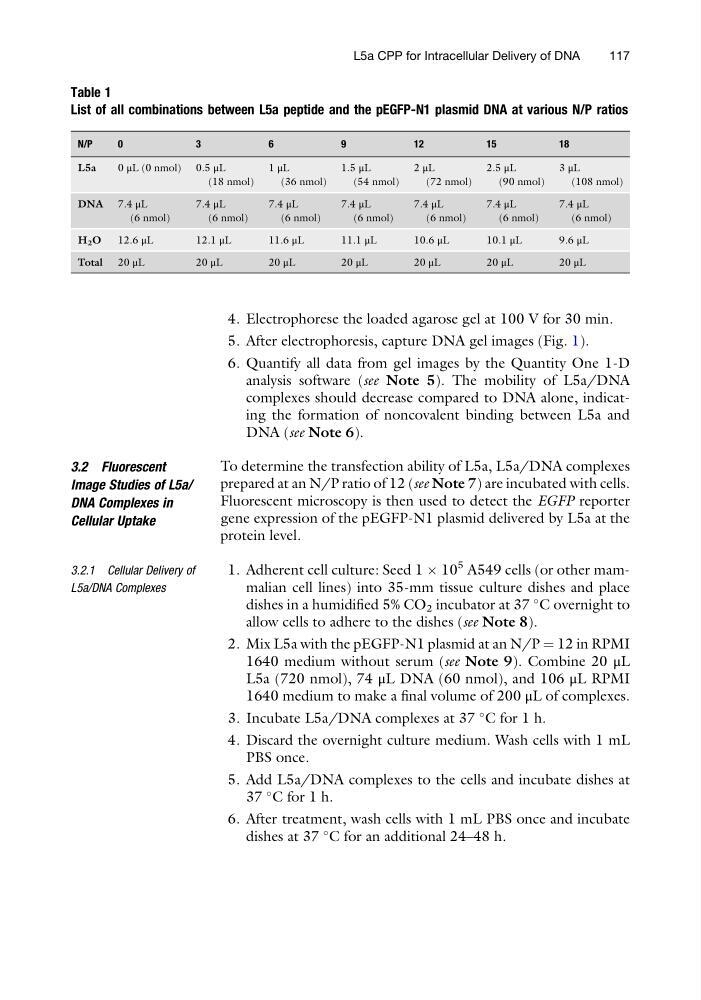
Table 1
List of all combinations between L5a peptide and the pEGFP-N1 plasmid DNA at various N/P ratios
N/P
0
3
6
9
12
15
18
L5a
0 μL (0 nmol) 0.5 μL
(18 nmol)
1 μL
(36 nmol)
1.5 μL
(54 nmol)
2 μL
(72 nmol)
2.5 μL
(90 nmol)
3 μL
(108 nmol)
DNA 7.4 μL
(6 nmol)
7.4 μL
(6 nmol)
7.4 μL
(6 nmol)
7.4 μL
(6 nmol)
7.4 μL
(6 nmol)
7.4 μL
(6 nmol)
7.4 μL
(6 nmol)
H 2 O
12.6 μL
12.1 μL
11.6 μL
11.1 μL
10.6 μL
10.1 μL
9.6 μL
Total 20 μL
2 0 μL
2 0 μL
2 0 μL
2 0 μL
2 0 μL
2 0 μL
L5a CPP for Intracellular Delivery of DNA
117
5. After electrophoresis, capture DNA gel images (Fig. 1).
6. Quantify all data from gel images by the Quantity One 1-D
analysis software (see Note 5). The mobility of L5a/DNA
complexes should decrease compared to DNA alone, indicating the formation of noncovalent binding between L5a and
DNA (see Note 6).
3.2 Fluorescent
Image Studies of L5a/
DNA Complexes in
Cellular Uptake
To determine the transfection ability of L5a, L5a/DNA complexes
prepared at an N/P ratio of 12 (see Note 7) are incubated with cells.
Fluorescent microscopy is then used to detect the EGFP reporter
gene expression of the pEGFP-N1 plasmid delivered by L5a at the
protein level.
3.2.1 Cellular Delivery of
L5a/DNA Complexes
1. Adherent cell culture: Seed 1 Â 10
5 A549 cells (or other mammalian cell lines) into 35-mm tissue culture dishes and place
dishes in a humidified 5% CO 2 incubator at 37
C overnight to
allow cells to adhere to the dishes (see Note 8).
2. Mix L5a with the pEGFP-N1 plasmid at an N/P ¼ 12 in RPMI
1640 medium without serum (see Note 9). Combine 20 μL
L5a (720 nmol), 74 μL DNA (60 nmol), and 106 μL RPMI
1640 medium to make a final volume of 200 μL of complexes.
3. Incubate L5a/DNA complexes at 37
C for 1 h.
4. Discard the overnight culture medium. Wash cells with 1 mL
PBS once.
5. Add L5a/DNA complexes to the cells and incubate dishes at
37
C for 1 h.
6. After treatment, wash cells with 1 mL PBS once and incubate
dishes at 37
C for an additional 24–48 h.
Table 1
List of all combinations between L5a peptide and the pEGFP-N1 plasmid DNA at various N/P ratios
N/P
0
3
6
9
12
15
18
L5a
0 μL (0 nmol) 0.5 μL
(18 nmol)
1 μL
(36 nmol)
1.5 μL
(54 nmol)
2 μL
(72 nmol)
2.5 μL
(90 nmol)
3 μL
(108 nmol)
DNA 7.4 μL
(6 nmol)
7.4 μL
(6 nmol)
7.4 μL
(6 nmol)
7.4 μL
(6 nmol)
7.4 μL
(6 nmol)
7.4 μL
(6 nmol)
7.4 μL
(6 nmol)
H 2 O
12.6 μL
12.1 μL
11.6 μL
11.1 μL
10.6 μL
10.1 μL
9.6 μL
Total 20 μL
2 0 μL
2 0 μL
2 0 μL
2 0 μL
2 0 μL
2 0 μL
L5a CPP for Intracellular Delivery of DNA
117