

2 General Relativity Measurements from Pulsars
61
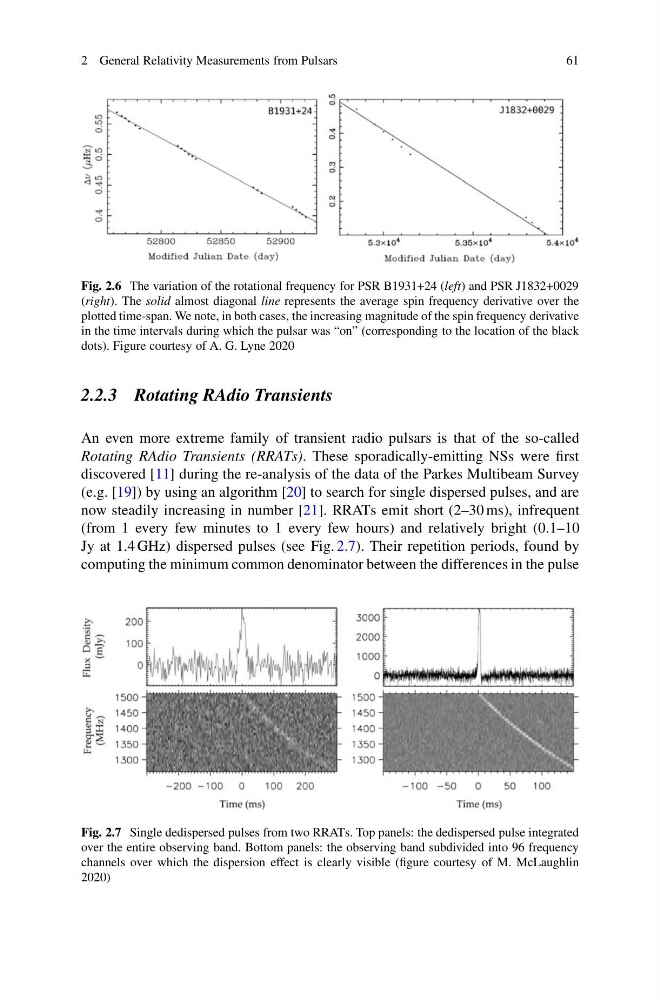
Fig. 2.6 The variation of the rotational frequency for PSR B1931+24 (left) and PSR J1832+0029
(right). The solid almost diagonal line represents the average spin frequency derivative over the
plotted time-span. We note, in both cases, the increasing magnitude of the spin frequency derivative
in the time intervals during which the pulsar was “on” (corresponding to the location of the black
dots). Figure courtesy of A. G. Lyne 2020
2.2.3 Rotating RAdio Transients
An even more extreme family of transient radio pulsars is that of the so-called
Rotating RAdio Transients (RRATs). These sporadically-emitting NSs were first
discovered [11] during the re-analysis of the data of the Parkes Multibeam Survey
(e.g. [19]) by using an algorithm [20] to search for single dispersed pulses, and are
now steadily increasing in number [21]. RRATs emit short (2–30 ms), infrequent
(from 1 every few minutes to 1 every few hours) and relatively bright (0.1–10
Jy at 1.4 GHz) dispersed pulses (see Fig. 2.7). Their repetition periods, found by
computing the minimum common denominator between the differences in the pulse
Fig. 2.7 Single dedispersed pulses from two RRATs. Top panels: the dedispersed pulse integrated
over the entire observing band. Bottom panels: the observing band subdivided into 96 frequency
channels over which the dispersion effect is clearly visible (figure courtesy of M. McLaughlin
2020)
61
Fig. 2.6 The variation of the rotational frequency for PSR B1931+24 (left) and PSR J1832+0029
(right). The solid almost diagonal line represents the average spin frequency derivative over the
plotted time-span. We note, in both cases, the increasing magnitude of the spin frequency derivative
in the time intervals during which the pulsar was “on” (corresponding to the location of the black
dots). Figure courtesy of A. G. Lyne 2020
2.2.3 Rotating RAdio Transients
An even more extreme family of transient radio pulsars is that of the so-called
Rotating RAdio Transients (RRATs). These sporadically-emitting NSs were first
discovered [11] during the re-analysis of the data of the Parkes Multibeam Survey
(e.g. [19]) by using an algorithm [20] to search for single dispersed pulses, and are
now steadily increasing in number [21]. RRATs emit short (2–30 ms), infrequent
(from 1 every few minutes to 1 every few hours) and relatively bright (0.1–10
Jy at 1.4 GHz) dispersed pulses (see Fig. 2.7). Their repetition periods, found by
computing the minimum common denominator between the differences in the pulse
Fig. 2.7 Single dedispersed pulses from two RRATs. Top panels: the dedispersed pulse integrated
over the entire observing band. Bottom panels: the observing band subdivided into 96 frequency
channels over which the dispersion effect is clearly visible (figure courtesy of M. McLaughlin
2020)