

56
M. Burgay et al.
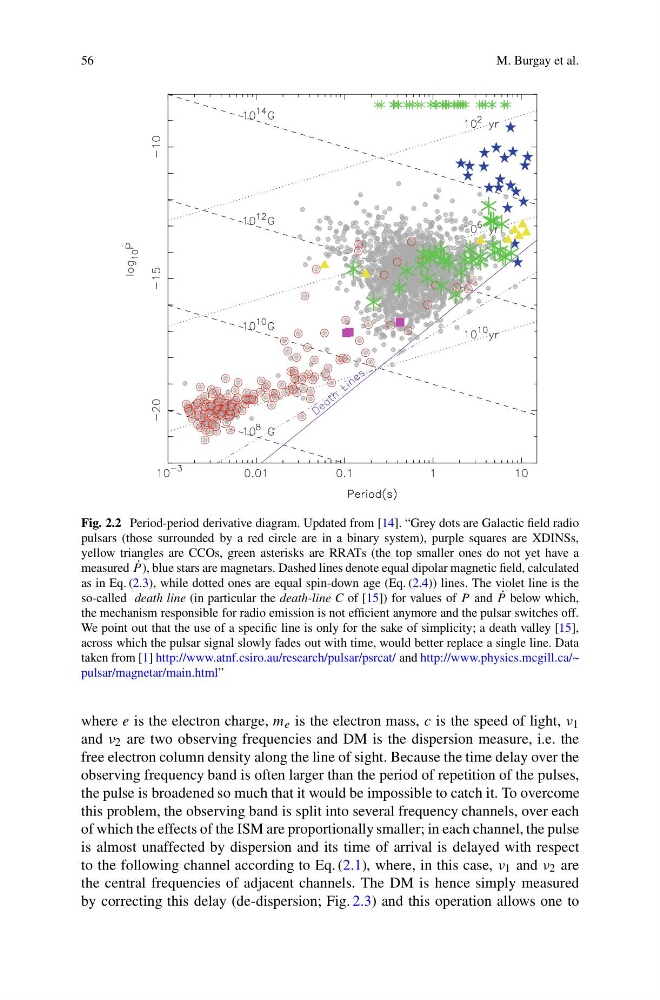
Fig. 2.2 Period-period derivative diagram. Updated from [14]. “Grey dots are Galactic field radio
pulsars (those surrounded by a red circle are in a binary system), purple squares are XDINSs,
yellow triangles are CCOs, green asterisks are RRATs (the top smaller ones do not yet have a
measured ˙
P ), blue stars are magnetars. Dashed lines denote equal dipolar magnetic field, calculated
as in Eq. (2.3), while dotted ones are equal spin-down age (Eq. (2.4)) lines. The violet line is the
so-called death line (in particular the death-line C of [15]) for values of P and ˙
P below which,
the mechanism responsible for radio emission is not efficient anymore and the pulsar switches off.
We point out that the use of a specific line is only for the sake of simplicity; a death valley [15],
across which the pulsar signal slowly fades out with time, would better replace a single line. Data
taken from [1] http://www.atnf.csiro.au/research/pulsar/psrcat/ and http://www.physics.mcgill.ca/~
pulsar/magnetar/main.html”
where e is the electron charge, m e is the electron mass, c is the speed of light, ν 1
and ν 2 are two observing frequencies and DM is the dispersion measure, i.e. the
free electron column density along the line of sight. Because the time delay over the
observing frequency band is often larger than the period of repetition of the pulses,
the pulse is broadened so much that it would be impossible to catch it. To overcome
this problem, the observing band is split into several frequency channels, over each
of which the effects of the ISM are proportionally smaller; in each channel, the pulse
is almost unaffected by dispersion and its time of arrival is delayed with respect
to the following channel according to Eq. (2.1), where, in this case, ν 1 and ν 2 are
the central frequencies of adjacent channels. The DM is hence simply measured
by correcting this delay (de-dispersion; Fig. 2.3) and this operation allows one to
M. Burgay et al.
Fig. 2.2 Period-period derivative diagram. Updated from [14]. “Grey dots are Galactic field radio
pulsars (those surrounded by a red circle are in a binary system), purple squares are XDINSs,
yellow triangles are CCOs, green asterisks are RRATs (the top smaller ones do not yet have a
measured ˙
P ), blue stars are magnetars. Dashed lines denote equal dipolar magnetic field, calculated
as in Eq. (2.3), while dotted ones are equal spin-down age (Eq. (2.4)) lines. The violet line is the
so-called death line (in particular the death-line C of [15]) for values of P and ˙
P below which,
the mechanism responsible for radio emission is not efficient anymore and the pulsar switches off.
We point out that the use of a specific line is only for the sake of simplicity; a death valley [15],
across which the pulsar signal slowly fades out with time, would better replace a single line. Data
taken from [1] http://www.atnf.csiro.au/research/pulsar/psrcat/ and http://www.physics.mcgill.ca/~
pulsar/magnetar/main.html”
where e is the electron charge, m e is the electron mass, c is the speed of light, ν 1
and ν 2 are two observing frequencies and DM is the dispersion measure, i.e. the
free electron column density along the line of sight. Because the time delay over the
observing frequency band is often larger than the period of repetition of the pulses,
the pulse is broadened so much that it would be impossible to catch it. To overcome
this problem, the observing band is split into several frequency channels, over each
of which the effects of the ISM are proportionally smaller; in each channel, the pulse
is almost unaffected by dispersion and its time of arrival is delayed with respect
to the following channel according to Eq. (2.1), where, in this case, ν 1 and ν 2 are
the central frequencies of adjacent channels. The DM is hence simply measured
by correcting this delay (de-dispersion; Fig. 2.3) and this operation allows one to