

306
M. Méndez and T. M. Belloni
650-750 Hz
750-850 Hz
850-950 Hz
Time lag [ s]
80
60
40
20
0
20
40
Energy [keV]
5
1 0
2 0
(a)
700-800 Hz
800-900 Hz
900-1000 Hz
1000-1100 Hz
Time lag [ s]
100
50
0
50
100
150
200
Energy [keV]
5
1 0
2 0
(b)
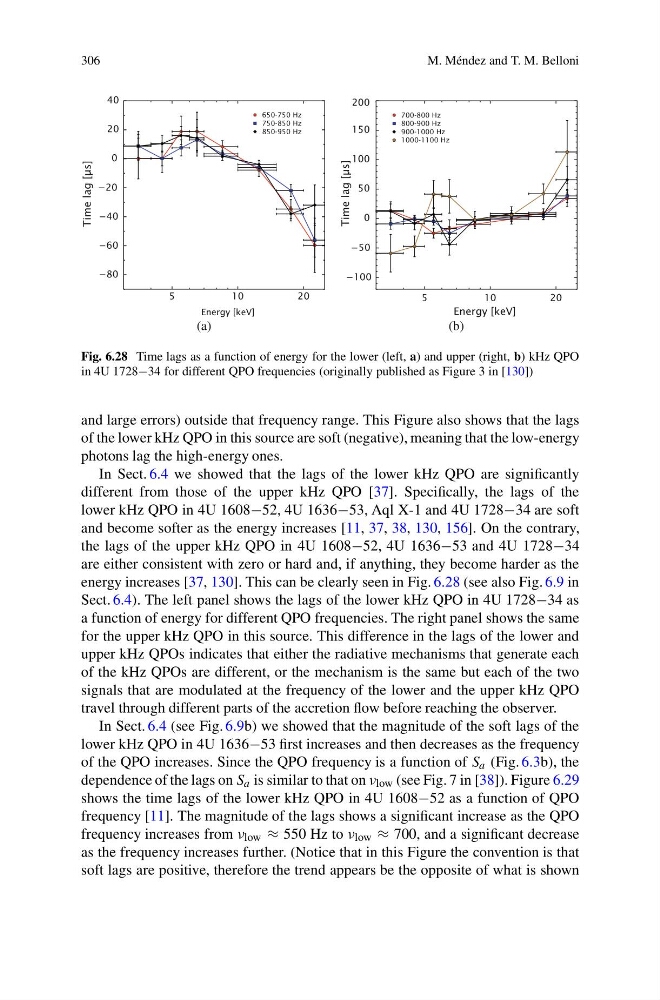
Fig. 6.28 Time lags as a function of energy for the lower (left, a) and upper (right, b) kHz QPO
in 4U 1728−34 for different QPO frequencies (originally published as Figure 3 in [130])
and large errors) outside that frequency range. This Figure also shows that the lags
of the lower kHz QPO in this source are soft (negative), meaning that the low-energy
photons lag the high-energy ones.
In Sect. 6.4 we showed that the lags of the lower kHz QPO are significantly
different from those of the upper kHz QPO [37]. Specifically, the lags of the
lower kHz QPO in 4U 1608−52, 4U 1636−53, Aql X-1 and 4U 1728−34 are soft
and become softer as the energy increases [11, 37, 38, 130, 156]. On the contrary,
the lags of the upper kHz QPO in 4U 1608−52, 4U 1636−53 and 4U 1728−34
are either consistent with zero or hard and, if anything, they become harder as the
energy increases [37, 130]. This can be clearly seen in Fig. 6.28 (see also Fig. 6.9 in
Sect. 6.4). The left panel shows the lags of the lower kHz QPO in 4U 1728−34 as
a function of energy for different QPO frequencies. The right panel shows the same
for the upper kHz QPO in this source. This difference in the lags of the lower and
upper kHz QPOs indicates that either the radiative mechanisms that generate each
of the kHz QPOs are different, or the mechanism is the same but each of the two
signals that are modulated at the frequency of the lower and the upper kHz QPO
travel through different parts of the accretion flow before reaching the observer.
In Sect. 6.4 (see Fig. 6.9b) we showed that the magnitude of the soft lags of the
lower kHz QPO in 4U 1636−53 first increases and then decreases as the frequency
of the QPO increases. Since the QPO frequency is a function of S a (Fig. 6.3b), the
dependence of the lags on S a is similar to that on ν low (see Fig. 7 in [38]). Figure 6.29
shows the time lags of the lower kHz QPO in 4U 1608−52 as a function of QPO
frequency [11]. The magnitude of the lags shows a significant increase as the QPO
frequency increases from ν low ≈ 550 Hz to ν low ≈ 700, and a significant decrease
as the frequency increases further. (Notice that in this Figure the convention is that
soft lags are positive, therefore the trend appears be the opposite of what is shown
M. Méndez and T. M. Belloni
650-750 Hz
750-850 Hz
850-950 Hz
Time lag [ s]
80
60
40
20
0
20
40
Energy [keV]
5
1 0
2 0
(a)
700-800 Hz
800-900 Hz
900-1000 Hz
1000-1100 Hz
Time lag [ s]
100
50
0
50
100
150
200
Energy [keV]
5
1 0
2 0
(b)
Fig. 6.28 Time lags as a function of energy for the lower (left, a) and upper (right, b) kHz QPO
in 4U 1728−34 for different QPO frequencies (originally published as Figure 3 in [130])
and large errors) outside that frequency range. This Figure also shows that the lags
of the lower kHz QPO in this source are soft (negative), meaning that the low-energy
photons lag the high-energy ones.
In Sect. 6.4 we showed that the lags of the lower kHz QPO are significantly
different from those of the upper kHz QPO [37]. Specifically, the lags of the
lower kHz QPO in 4U 1608−52, 4U 1636−53, Aql X-1 and 4U 1728−34 are soft
and become softer as the energy increases [11, 37, 38, 130, 156]. On the contrary,
the lags of the upper kHz QPO in 4U 1608−52, 4U 1636−53 and 4U 1728−34
are either consistent with zero or hard and, if anything, they become harder as the
energy increases [37, 130]. This can be clearly seen in Fig. 6.28 (see also Fig. 6.9 in
Sect. 6.4). The left panel shows the lags of the lower kHz QPO in 4U 1728−34 as
a function of energy for different QPO frequencies. The right panel shows the same
for the upper kHz QPO in this source. This difference in the lags of the lower and
upper kHz QPOs indicates that either the radiative mechanisms that generate each
of the kHz QPOs are different, or the mechanism is the same but each of the two
signals that are modulated at the frequency of the lower and the upper kHz QPO
travel through different parts of the accretion flow before reaching the observer.
In Sect. 6.4 (see Fig. 6.9b) we showed that the magnitude of the soft lags of the
lower kHz QPO in 4U 1636−53 first increases and then decreases as the frequency
of the QPO increases. Since the QPO frequency is a function of S a (Fig. 6.3b), the
dependence of the lags on S a is similar to that on ν low (see Fig. 7 in [38]). Figure 6.29
shows the time lags of the lower kHz QPO in 4U 1608−52 as a function of QPO
frequency [11]. The magnitude of the lags shows a significant increase as the QPO
frequency increases from ν low ≈ 550 Hz to ν low ≈ 700, and a significant decrease
as the frequency increases further. (Notice that in this Figure the convention is that
soft lags are positive, therefore the trend appears be the opposite of what is shown