

6 High-Frequency Variability in Neutron-Star Low-Mass X-ray Binaries
301
a particle orbiting the neutron star when it approaches the ISCO, the gas will move
a certain radial distance Δr drift during the lifetime of the oscillation, leading to a
change Δν drift ≈
3
2
Δr drift
r orb
ν orb of the frequency of the oscillations during this time.
Second, the region in the disc where the QPO is formed is stretched in the radial
direction, leading to a range of frequencies of the oscillations Δν orb ≈
3
2
Δr orb
r orb
ν orb .
Finally, the finite lifetime of the oscillations adds to the width of the QPO profile.
The solid curve in Fig. 6.23 shows a simplified calculation of these effects
combined, for a set of parameters that roughly reproduce the data, and that yield
a neutron-star mass of ∼2M or higher. In this model, at frequencies above
ν low ≈ 800 Hz the main contribution to the width of the QPO is from the drift
of the QPO frequency, Δν drift . If this interpretation is correct, the drop of the quality
factor of the lower kHz QPO in this and other sources would provide a constrain
to the mass of the neutron star, and a direct evidence of the existence of the ISCO
around the neutron star in these systems.
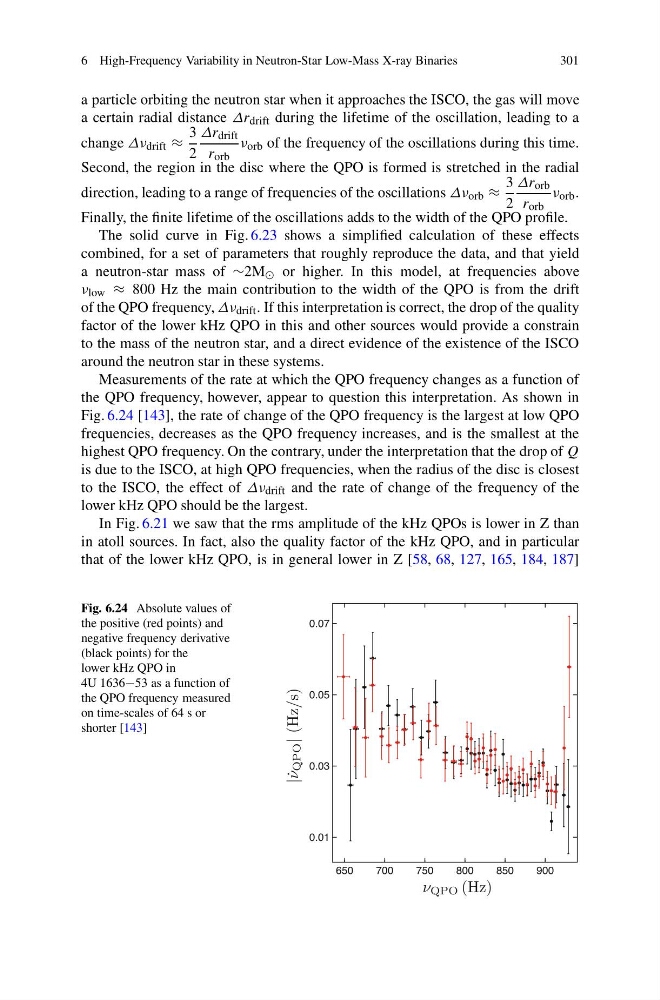
Measurements of the rate at which the QPO frequency changes as a function of
the QPO frequency, however, appear to question this interpretation. As shown in
Fig. 6.24 [143], the rate of change of the QPO frequency is the largest at low QPO
frequencies, decreases as the QPO frequency increases, and is the smallest at the
highest QPO frequency. On the contrary, under the interpretation that the drop of Q
is due to the ISCO, at high QPO frequencies, when the radius of the disc is closest
to the ISCO, the effect of Δν drift and the rate of change of the frequency of the
lower kHz QPO should be the largest.
In Fig. 6.21 we saw that the rms amplitude of the kHz QPOs is lower in Z than
in atoll sources. In fact, also the quality factor of the kHz QPO, and in particular
that of the lower kHz QPO, is in general lower in Z [58, 68, 127, 165, 184, 187]
Fig. 6.24 Absolute values of
the positive (red points) and
negative frequency derivative
(black points) for the
lower kHz QPO in
4U 1636−53 as a function of
the QPO frequency measured
on time-scales of 64 s or
shorter [143]
301
a particle orbiting the neutron star when it approaches the ISCO, the gas will move
a certain radial distance Δr drift during the lifetime of the oscillation, leading to a
change Δν drift ≈
3
2
Δr drift
r orb
ν orb of the frequency of the oscillations during this time.
Second, the region in the disc where the QPO is formed is stretched in the radial
direction, leading to a range of frequencies of the oscillations Δν orb ≈
3
2
Δr orb
r orb
ν orb .
Finally, the finite lifetime of the oscillations adds to the width of the QPO profile.
The solid curve in Fig. 6.23 shows a simplified calculation of these effects
combined, for a set of parameters that roughly reproduce the data, and that yield
a neutron-star mass of ∼2M or higher. In this model, at frequencies above
ν low ≈ 800 Hz the main contribution to the width of the QPO is from the drift
of the QPO frequency, Δν drift . If this interpretation is correct, the drop of the quality
factor of the lower kHz QPO in this and other sources would provide a constrain
to the mass of the neutron star, and a direct evidence of the existence of the ISCO
around the neutron star in these systems.
Measurements of the rate at which the QPO frequency changes as a function of
the QPO frequency, however, appear to question this interpretation. As shown in
Fig. 6.24 [143], the rate of change of the QPO frequency is the largest at low QPO
frequencies, decreases as the QPO frequency increases, and is the smallest at the
highest QPO frequency. On the contrary, under the interpretation that the drop of Q
is due to the ISCO, at high QPO frequencies, when the radius of the disc is closest
to the ISCO, the effect of Δν drift and the rate of change of the frequency of the
lower kHz QPO should be the largest.
In Fig. 6.21 we saw that the rms amplitude of the kHz QPOs is lower in Z than
in atoll sources. In fact, also the quality factor of the kHz QPO, and in particular
that of the lower kHz QPO, is in general lower in Z [58, 68, 127, 165, 184, 187]
Fig. 6.24 Absolute values of
the positive (red points) and
negative frequency derivative
(black points) for the
lower kHz QPO in
4U 1636−53 as a function of
the QPO frequency measured
on time-scales of 64 s or
shorter [143]