

6 High-Frequency Variability in Neutron-Star Low-Mass X-ray Binaries
299
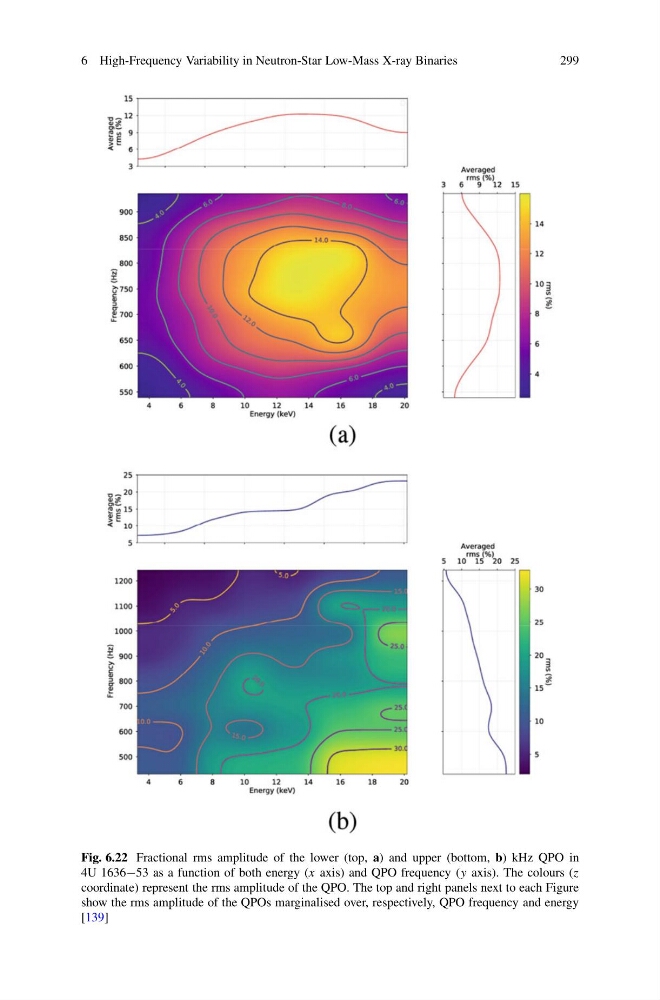
Fig. 6.22 Fractional rms amplitude of the lower (top, a) and upper (bottom, b) kHz QPO in
4U 1636−53 as a function of both energy (x axis) and QPO frequency (y axis). The colours (z
coordinate) represent the rms amplitude of the QPO. The top and right panels next to each Figure
show the rms amplitude of the QPOs marginalised over, respectively, QPO frequency and energy
[139]
299
Fig. 6.22 Fractional rms amplitude of the lower (top, a) and upper (bottom, b) kHz QPO in
4U 1636−53 as a function of both energy (x axis) and QPO frequency (y axis). The colours (z
coordinate) represent the rms amplitude of the QPO. The top and right panels next to each Figure
show the rms amplitude of the QPOs marginalised over, respectively, QPO frequency and energy
[139]