

290
M. Méndez and T. M. Belloni
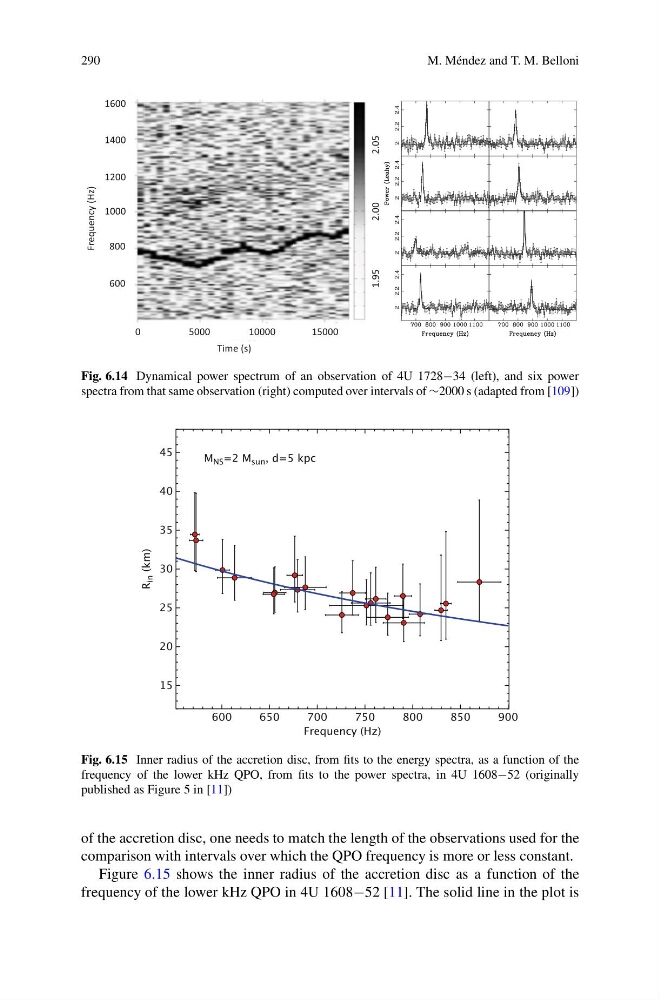
Fig. 6.14 Dynamical power spectrum of an observation of 4U 1728−34 (left), and six power
spectra from that same observation (right) computed over intervals of ∼2000 s (adapted from [109])
Fig. 6.15 Inner radius of the accretion disc, from fits to the energy spectra, as a function of the
frequency of the lower kHz QPO, from fits to the power spectra, in 4U 1608−52 (originally
published as Figure 5 in [11])
of the accretion disc, one needs to match the length of the observations used for the
comparison with intervals over which the QPO frequency is more or less constant.
Figure 6.15 shows the inner radius of the accretion disc as a function of the
frequency of the lower kHz QPO in 4U 1608−52 [11]. The solid line in the plot is
M. Méndez and T. M. Belloni
Fig. 6.14 Dynamical power spectrum of an observation of 4U 1728−34 (left), and six power
spectra from that same observation (right) computed over intervals of ∼2000 s (adapted from [109])
Fig. 6.15 Inner radius of the accretion disc, from fits to the energy spectra, as a function of the
frequency of the lower kHz QPO, from fits to the power spectra, in 4U 1608−52 (originally
published as Figure 5 in [11])
of the accretion disc, one needs to match the length of the observations used for the
comparison with intervals over which the QPO frequency is more or less constant.
Figure 6.15 shows the inner radius of the accretion disc as a function of the
frequency of the lower kHz QPO in 4U 1608−52 [11]. The solid line in the plot is