

274
M. Méndez and T. M. Belloni
while the bottom panel shows the frequency of both kHz QPOs as a function of S a .
The two kHz QPOs are clearly separated in these two plots, and the parallel tracks of
Fig. 6.2a collapse into a single track (one for each kHz QPO) when the frequencies
of the QPOs are plotted against the hard colour or S a . By the way, since the position
of the source in the colour-colour diagram, and therefore hard colour and the value
of S a , is driven by changes of the source spectrum, it should be no surprise that
the relation of the QPO frequency with the parameters of the models used to fit the
energy spectrum also consists of a single track. We will discuss this in Sect. 6.7.
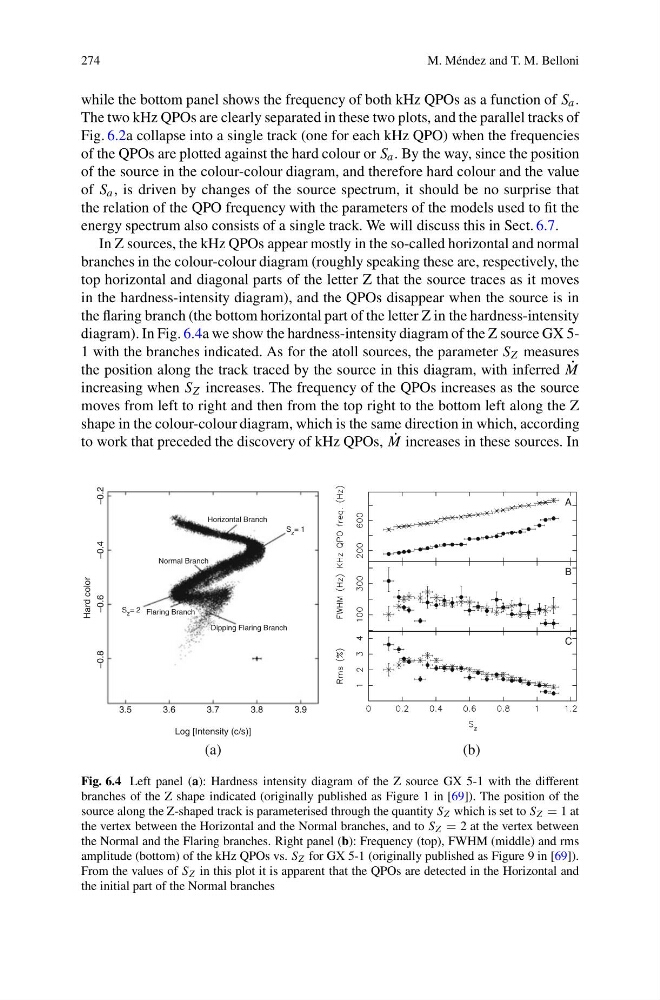
In Z sources, the kHz QPOs appear mostly in the so-called horizontal and normal
branches in the colour-colour diagram (roughly speaking these are, respectively, the
top horizontal and diagonal parts of the letter Z that the source traces as it moves
in the hardness-intensity diagram), and the QPOs disappear when the source is in
the flaring branch (the bottom horizontal part of the letter Z in the hardness-intensity
diagram). In Fig. 6.4a we show the hardness-intensity diagram of the Z source GX 51 with the branches indicated. As for the atoll sources, the parameter S Z measures
the position along the track traced by the source in this diagram, with inferred ˙
M
increasing when S Z increases. The frequency of the QPOs increases as the source
moves from left to right and then from the top right to the bottom left along the Z
shape in the colour-colour diagram, which is the same direction in which, according
to work that preceded the discovery of kHz QPOs, ˙
M increases in these sources. In
(a)
A
B
C
(b)
3.5
–0.8
–0.6
Hard color
–0.4
–0.2
3.6
3.7
Log [Intensity (c/s)]
Dipping Flaring Branch
Flaring Branch
Normal Branch
Horizontal Branch
S z = 2
S z = 1
3.8
3.9
Fig. 6.4 Left panel (a): Hardness intensity diagram of the Z source GX 5-1 with the different
branches of the Z shape indicated (originally published as Figure 1 in [69]). The position of the
source along the Z-shaped track is parameterised through the quantity S Z which is set to S Z = 1 at
the vertex between the Horizontal and the Normal branches, and to S Z = 2 at the vertex between
the Normal and the Flaring branches. Right panel (b): Frequency (top), FWHM (middle) and rms
amplitude (bottom) of the kHz QPOs vs. S Z for GX 5-1 (originally published as Figure 9 in [69]).
From the values of S Z in this plot it is apparent that the QPOs are detected in the Horizontal and
the initial part of the Normal branches
M. Méndez and T. M. Belloni
while the bottom panel shows the frequency of both kHz QPOs as a function of S a .
The two kHz QPOs are clearly separated in these two plots, and the parallel tracks of
Fig. 6.2a collapse into a single track (one for each kHz QPO) when the frequencies
of the QPOs are plotted against the hard colour or S a . By the way, since the position
of the source in the colour-colour diagram, and therefore hard colour and the value
of S a , is driven by changes of the source spectrum, it should be no surprise that
the relation of the QPO frequency with the parameters of the models used to fit the
energy spectrum also consists of a single track. We will discuss this in Sect. 6.7.
In Z sources, the kHz QPOs appear mostly in the so-called horizontal and normal
branches in the colour-colour diagram (roughly speaking these are, respectively, the
top horizontal and diagonal parts of the letter Z that the source traces as it moves
in the hardness-intensity diagram), and the QPOs disappear when the source is in
the flaring branch (the bottom horizontal part of the letter Z in the hardness-intensity
diagram). In Fig. 6.4a we show the hardness-intensity diagram of the Z source GX 51 with the branches indicated. As for the atoll sources, the parameter S Z measures
the position along the track traced by the source in this diagram, with inferred ˙
M
increasing when S Z increases. The frequency of the QPOs increases as the source
moves from left to right and then from the top right to the bottom left along the Z
shape in the colour-colour diagram, which is the same direction in which, according
to work that preceded the discovery of kHz QPOs, ˙
M increases in these sources. In
(a)
A
B
C
(b)
3.5
–0.8
–0.6
Hard color
–0.4
–0.2
3.6
3.7
Log [Intensity (c/s)]
Dipping Flaring Branch
Flaring Branch
Normal Branch
Horizontal Branch
S z = 2
S z = 1
3.8
3.9
Fig. 6.4 Left panel (a): Hardness intensity diagram of the Z source GX 5-1 with the different
branches of the Z shape indicated (originally published as Figure 1 in [69]). The position of the
source along the Z-shaped track is parameterised through the quantity S Z which is set to S Z = 1 at
the vertex between the Horizontal and the Normal branches, and to S Z = 2 at the vertex between
the Normal and the Flaring branches. Right panel (b): Frequency (top), FWHM (middle) and rms
amplitude (bottom) of the kHz QPOs vs. S Z for GX 5-1 (originally published as Figure 9 in [69]).
From the values of S Z in this plot it is apparent that the QPOs are detected in the Horizontal and
the initial part of the Normal branches