

6 High-Frequency Variability in Neutron-Star Low-Mass X-ray Binaries
273
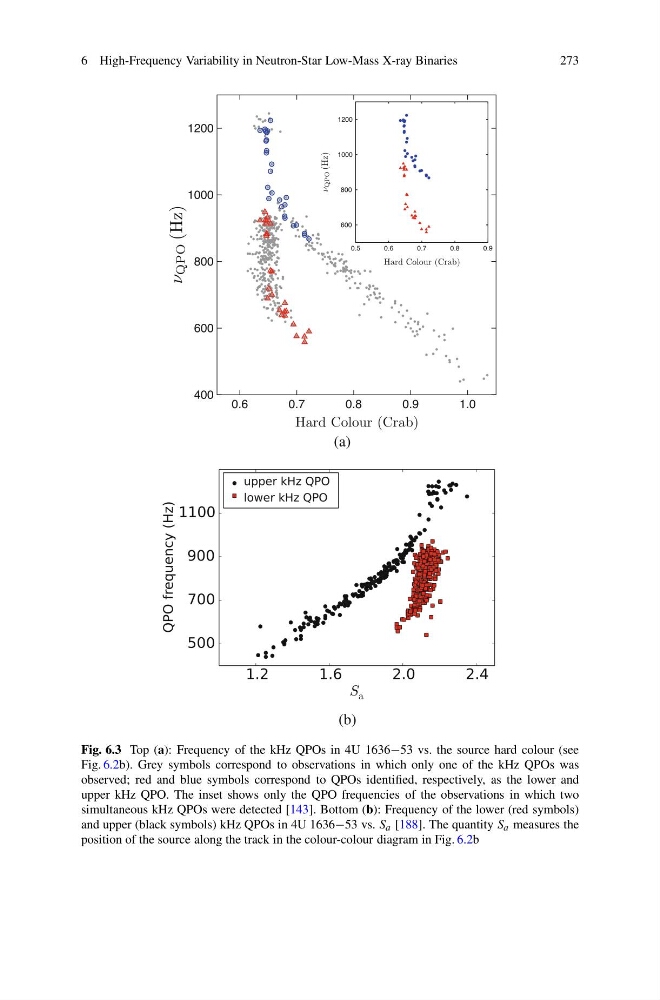
Fig. 6.3 Top (a): Frequency of the kHz QPOs in 4U 1636−53 vs. the source hard colour (see
Fig. 6.2b). Grey symbols correspond to observations in which only one of the kHz QPOs was
observed; red and blue symbols correspond to QPOs identified, respectively, as the lower and
upper kHz QPO. The inset shows only the QPO frequencies of the observations in which two
simultaneous kHz QPOs were detected [143]. Bottom (b): Frequency of the lower (red symbols)
and upper (black symbols) kHz QPOs in 4U 1636−53 vs. S a [188]. The quantity S a measures the
position of the source along the track in the colour-colour diagram in Fig. 6.2b
273
Fig. 6.3 Top (a): Frequency of the kHz QPOs in 4U 1636−53 vs. the source hard colour (see
Fig. 6.2b). Grey symbols correspond to observations in which only one of the kHz QPOs was
observed; red and blue symbols correspond to QPOs identified, respectively, as the lower and
upper kHz QPO. The inset shows only the QPO frequencies of the observations in which two
simultaneous kHz QPOs were detected [143]. Bottom (b): Frequency of the lower (red symbols)
and upper (black symbols) kHz QPOs in 4U 1636−53 vs. S a [188]. The quantity S a measures the
position of the source along the track in the colour-colour diagram in Fig. 6.2b