

3 Magnetars: A Short Review and Some Sparse Considerations
119
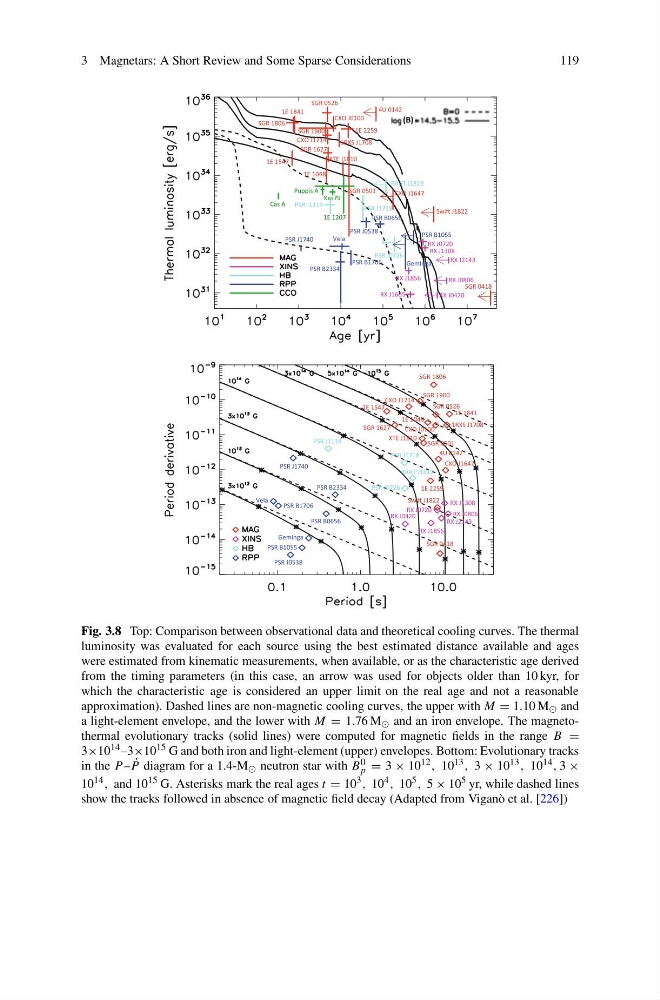
Fig. 3.8 Top: Comparison between observational data and theoretical cooling curves. The thermal
luminosity was evaluated for each source using the best estimated distance available and ages
were estimated from kinematic measurements, when available, or as the characteristic age derived
from the timing parameters (in this case, an arrow was used for objects older than 10 kyr, for
which the characteristic age is considered an upper limit on the real age and not a reasonable
approximation). Dashed lines are non-magnetic cooling curves, the upper with M = 1.10 M and
a light-element envelope, and the lower with M = 1.76 M and an iron envelope. The magnetothermal evolutionary tracks (solid lines) were computed for magnetic fields in the range B =
3×10 14 –3×10 15 G and both iron and light-element (upper) envelopes. Bottom: Evolutionary tracks
in the P – ˙
P diagram for a 1.4-M neutron star with B 0
p = 3 × 10 12 , 10 13 , 3 × 10 13 , 10 14 , 3 ×
10 14 , and 10 15 G. Asterisks mark the real ages t = 10 3 , 10 4 , 10 5 , 5 × 10 5 yr, while dashed lines
show the tracks followed in absence of magnetic field decay (Adapted from Viganò et al. [226])
119
Fig. 3.8 Top: Comparison between observational data and theoretical cooling curves. The thermal
luminosity was evaluated for each source using the best estimated distance available and ages
were estimated from kinematic measurements, when available, or as the characteristic age derived
from the timing parameters (in this case, an arrow was used for objects older than 10 kyr, for
which the characteristic age is considered an upper limit on the real age and not a reasonable
approximation). Dashed lines are non-magnetic cooling curves, the upper with M = 1.10 M and
a light-element envelope, and the lower with M = 1.76 M and an iron envelope. The magnetothermal evolutionary tracks (solid lines) were computed for magnetic fields in the range B =
3×10 14 –3×10 15 G and both iron and light-element (upper) envelopes. Bottom: Evolutionary tracks
in the P – ˙
P diagram for a 1.4-M neutron star with B 0
p = 3 × 10 12 , 10 13 , 3 × 10 13 , 10 14 , 3 ×
10 14 , and 10 15 G. Asterisks mark the real ages t = 10 3 , 10 4 , 10 5 , 5 × 10 5 yr, while dashed lines
show the tracks followed in absence of magnetic field decay (Adapted from Viganò et al. [226])