

17.4 The Anisotropies of the CMB
271
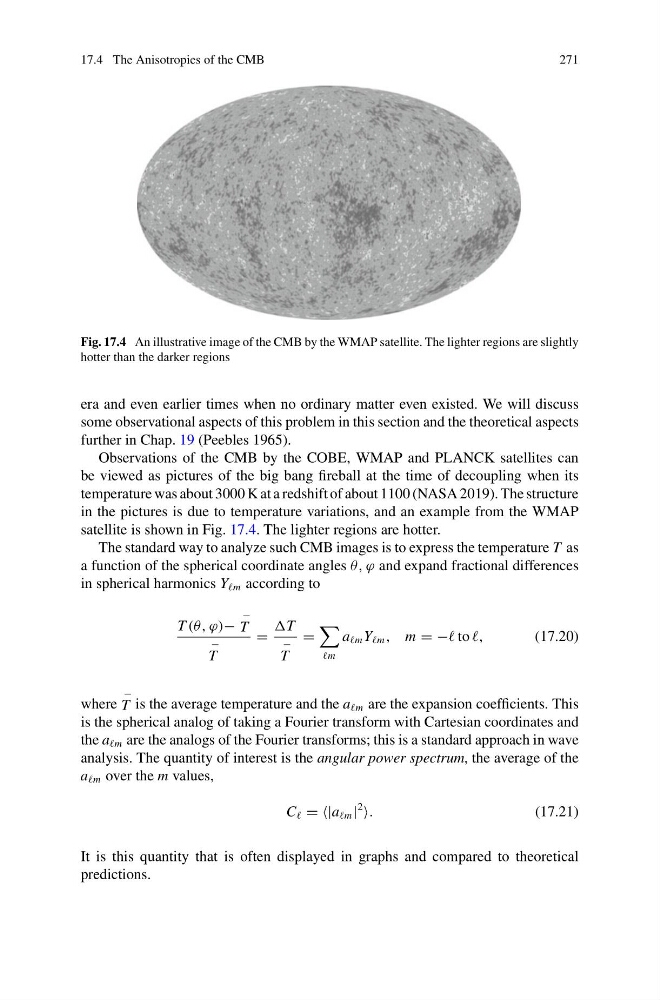
Fig. 17.4 An illustrative image of the CMB by the WMAP satellite. The lighter regions are slightly
hotter than the darker regions
era and even earlier times when no ordinary matter even existed. We will discuss
some observational aspects of this problem in this section and the theoretical aspects
further in Chap. 19 (Peebles 1965).
Observations of the CMB by the COBE, WMAP and PLANCK satellites can
be viewed as pictures of the big bang fireball at the time of decoupling when its
temperature was about 3000 K at a redshift of about 1100 (NASA 2019). The structure
in the pictures is due to temperature variations, and an example from the WMAP
satellite is shown in Fig. 17.4. The lighter regions are hotter.
The standard way to analyze such CMB images is to express the temperature T as
a function of the spherical coordinate angles θ, ϕ and expand fractional differences
in spherical harmonics Y m according to
T (θ, ϕ)−
−
T
−
T
=
T
−
T
=
m
a m Y m , m = − to ,
(17.20)
where
−
T is the average temperature and the a m are the expansion coefficients. This
is the spherical analog of taking a Fourier transform with Cartesian coordinates and
the a m are the analogs of the Fourier transforms; this is a standard approach in wave
analysis. The quantity of interest is the angular power spectrum, the average of the
a m over the m values,
C = =|a m |
2
.
(17.21)
It is this quantity that is often displayed in graphs and compared to theoretical
predictions.
271
Fig. 17.4 An illustrative image of the CMB by the WMAP satellite. The lighter regions are slightly
hotter than the darker regions
era and even earlier times when no ordinary matter even existed. We will discuss
some observational aspects of this problem in this section and the theoretical aspects
further in Chap. 19 (Peebles 1965).
Observations of the CMB by the COBE, WMAP and PLANCK satellites can
be viewed as pictures of the big bang fireball at the time of decoupling when its
temperature was about 3000 K at a redshift of about 1100 (NASA 2019). The structure
in the pictures is due to temperature variations, and an example from the WMAP
satellite is shown in Fig. 17.4. The lighter regions are hotter.
The standard way to analyze such CMB images is to express the temperature T as
a function of the spherical coordinate angles θ, ϕ and expand fractional differences
in spherical harmonics Y m according to
T (θ, ϕ)−
−
T
−
T
=
T
−
T
=
m
a m Y m , m = − to ,
(17.20)
where
−
T is the average temperature and the a m are the expansion coefficients. This
is the spherical analog of taking a Fourier transform with Cartesian coordinates and
the a m are the analogs of the Fourier transforms; this is a standard approach in wave
analysis. The quantity of interest is the angular power spectrum, the average of the
a m over the m values,
C = =|a m |
2
.
(17.21)
It is this quantity that is often displayed in graphs and compared to theoretical
predictions.