

62
C. Juhong et al.
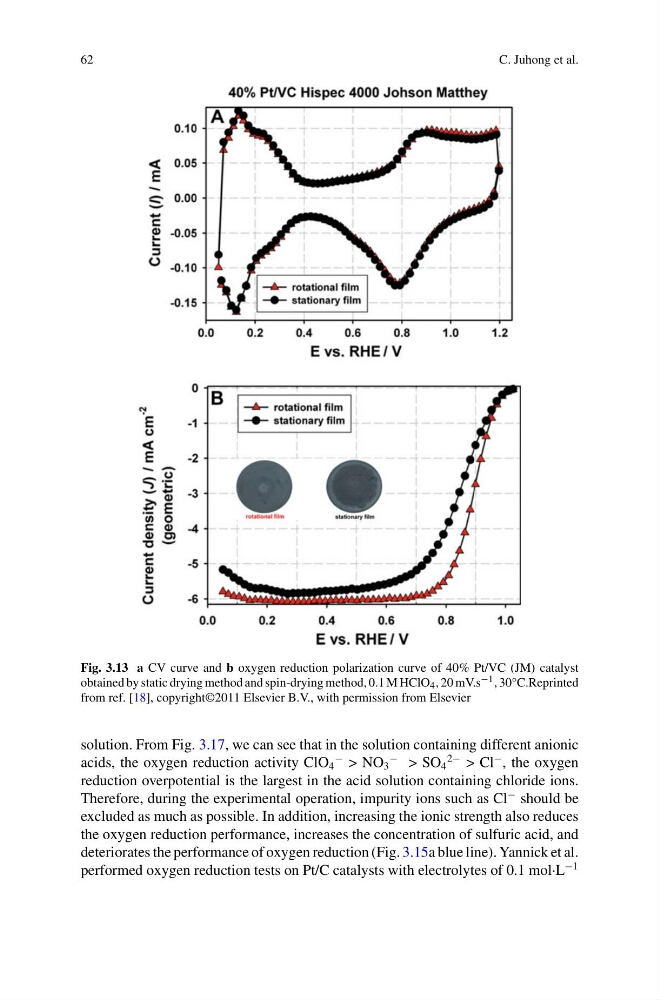
Fig. 3.13 a CV curve and b oxygen reduction polarization curve of 40% Pt/VC (JM) catalyst
obtained by static drying method and spin-drying method, 0.1 M HClO 4 , 20 mV.s −1 , 30°C.Reprinted
from ref. [18], copyright©2011 Elsevier B.V., with permission from Elsevier
solution. From Fig. 3.17, we can see that in the solution containing different anionic
acids, the oxygen reduction activity ClO 4
− > NO 3
− > SO 4
2− > Cl
− , the oxygen
reduction overpotential is the largest in the acid solution containing chloride ions.
Therefore, during the experimental operation, impurity ions such as Cl
− should be
excluded as much as possible. In addition, increasing the ionic strength also reduces
the oxygen reduction performance, increases the concentration of sulfuric acid, and
deteriorates the performance of oxygen reduction (Fig. 3.15a blue line). Yannick et al.
performed oxygen reduction tests on Pt/C catalysts with electrolytes of 0.1 mol·L
−1
C. Juhong et al.
Fig. 3.13 a CV curve and b oxygen reduction polarization curve of 40% Pt/VC (JM) catalyst
obtained by static drying method and spin-drying method, 0.1 M HClO 4 , 20 mV.s −1 , 30°C.Reprinted
from ref. [18], copyright©2011 Elsevier B.V., with permission from Elsevier
solution. From Fig. 3.17, we can see that in the solution containing different anionic
acids, the oxygen reduction activity ClO 4
− > NO 3
− > SO 4
2− > Cl
− , the oxygen
reduction overpotential is the largest in the acid solution containing chloride ions.
Therefore, during the experimental operation, impurity ions such as Cl
− should be
excluded as much as possible. In addition, increasing the ionic strength also reduces
the oxygen reduction performance, increases the concentration of sulfuric acid, and
deteriorates the performance of oxygen reduction (Fig. 3.15a blue line). Yannick et al.
performed oxygen reduction tests on Pt/C catalysts with electrolytes of 0.1 mol·L
−1