

224
J. Zhu et al.
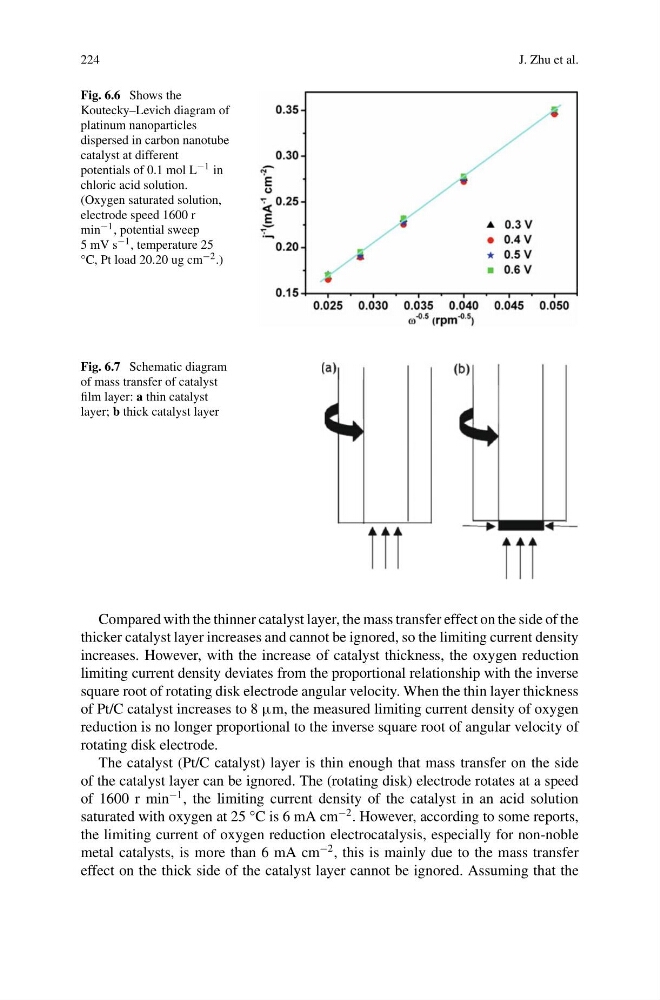
Fig. 6.6 Shows the
Koutecky–Levich diagram of
platinum nanoparticles
dispersed in carbon nanotube
catalyst at different
potentials of 0.1 mol L −1 in
chloric acid solution.
(Oxygen saturated solution,
electrode speed 1600 r
min −1 , potential sweep
5 mV s −1 , temperature 25
°C, Pt load 20.20 ug cm −2 .)
Fig. 6.7 Schematic diagram
of mass transfer of catalyst
film layer: a thin catalyst
layer; b thick catalyst layer
Compared with the thinner catalyst layer, the mass transfer effect on the side of the
thicker catalyst layer increases and cannot be ignored, so the limiting current density
increases. However, with the increase of catalyst thickness, the oxygen reduction
limiting current density deviates from the proportional relationship with the inverse
square root of rotating disk electrode angular velocity. When the thin layer thickness
of Pt/C catalyst increases to 8 μm, the measured limiting current density of oxygen
reduction is no longer proportional to the inverse square root of angular velocity of
rotating disk electrode.
The catalyst (Pt/C catalyst) layer is thin enough that mass transfer on the side
of the catalyst layer can be ignored. The (rotating disk) electrode rotates at a speed
of 1600 r min
−1 , the limiting current density of the catalyst in an acid solution
saturated with oxygen at 25 °C is 6 mA cm
−2 . However, according to some reports,
the limiting current of oxygen reduction electrocatalysis, especially for non-noble
metal catalysts, is more than 6 mA cm
−2 , this is mainly due to the mass transfer
effect on the thick side of the catalyst layer cannot be ignored. Assuming that the
J. Zhu et al.
Fig. 6.6 Shows the
Koutecky–Levich diagram of
platinum nanoparticles
dispersed in carbon nanotube
catalyst at different
potentials of 0.1 mol L −1 in
chloric acid solution.
(Oxygen saturated solution,
electrode speed 1600 r
min −1 , potential sweep
5 mV s −1 , temperature 25
°C, Pt load 20.20 ug cm −2 .)
Fig. 6.7 Schematic diagram
of mass transfer of catalyst
film layer: a thin catalyst
layer; b thick catalyst layer
Compared with the thinner catalyst layer, the mass transfer effect on the side of the
thicker catalyst layer increases and cannot be ignored, so the limiting current density
increases. However, with the increase of catalyst thickness, the oxygen reduction
limiting current density deviates from the proportional relationship with the inverse
square root of rotating disk electrode angular velocity. When the thin layer thickness
of Pt/C catalyst increases to 8 μm, the measured limiting current density of oxygen
reduction is no longer proportional to the inverse square root of angular velocity of
rotating disk electrode.
The catalyst (Pt/C catalyst) layer is thin enough that mass transfer on the side
of the catalyst layer can be ignored. The (rotating disk) electrode rotates at a speed
of 1600 r min
−1 , the limiting current density of the catalyst in an acid solution
saturated with oxygen at 25 °C is 6 mA cm
−2 . However, according to some reports,
the limiting current of oxygen reduction electrocatalysis, especially for non-noble
metal catalysts, is more than 6 mA cm
−2 , this is mainly due to the mass transfer
effect on the thick side of the catalyst layer cannot be ignored. Assuming that the