

4 Catalyst Materials for Oxygen Reduction Reaction
121
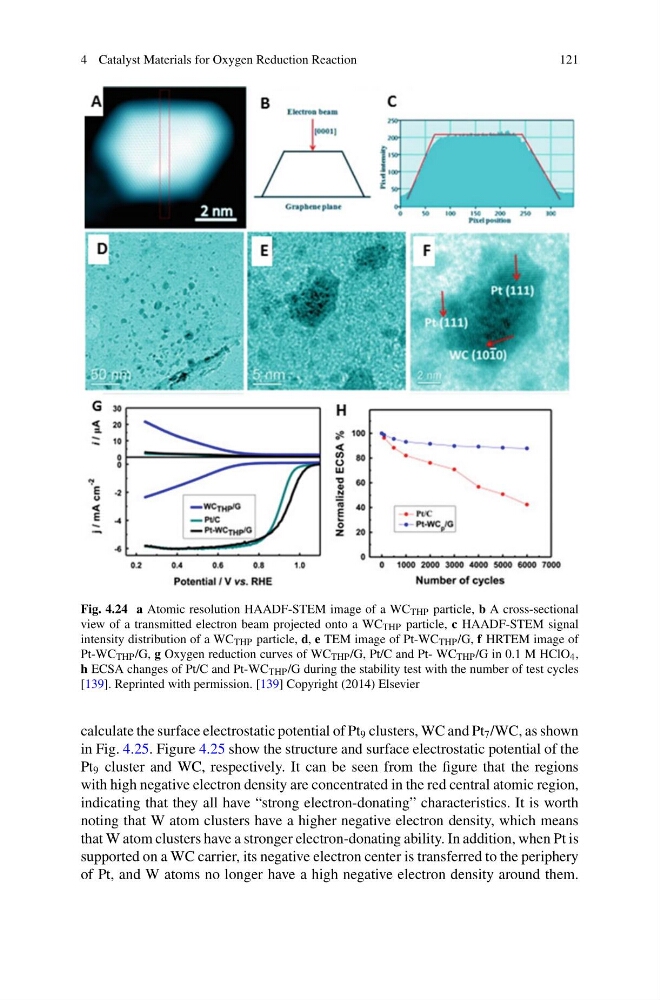
Fig. 4.24 a Atomic resolution HAADF-STEM image of a WC THP particle, b A cross-sectional
view of a transmitted electron beam projected onto a WC THP particle, c HAADF-STEM signal
intensity distribution of a WC THP particle, d, e TEM image of Pt-WC THP /G, f HRTEM image of
Pt-WC THP /G, g Oxygen reduction curves of WC THP /G, Pt/C and Pt- WC THP /G in 0.1 M HClO 4 ,
h ECSA changes of Pt/C and Pt-WC THP /G during the stability test with the number of test cycles
[139]. Reprinted with permission. [139] Copyright (2014) Elsevier
calculate the surface electrostatic potential of Pt 9 clusters, WC and Pt 7 /WC, as shown
in Fig. 4.25. Figure 4.25 show the structure and surface electrostatic potential of the
Pt 9 cluster and WC, respectively. It can be seen from the figure that the regions
with high negative electron density are concentrated in the red central atomic region,
indicating that they all have “strong electron-donating” characteristics. It is worth
noting that W atom clusters have a higher negative electron density, which means
that W atom clusters have a stronger electron-donating ability. In addition, when Pt is
supported on a WC carrier, its negative electron center is transferred to the periphery
of Pt, and W atoms no longer have a high negative electron density around them.
121
Fig. 4.24 a Atomic resolution HAADF-STEM image of a WC THP particle, b A cross-sectional
view of a transmitted electron beam projected onto a WC THP particle, c HAADF-STEM signal
intensity distribution of a WC THP particle, d, e TEM image of Pt-WC THP /G, f HRTEM image of
Pt-WC THP /G, g Oxygen reduction curves of WC THP /G, Pt/C and Pt- WC THP /G in 0.1 M HClO 4 ,
h ECSA changes of Pt/C and Pt-WC THP /G during the stability test with the number of test cycles
[139]. Reprinted with permission. [139] Copyright (2014) Elsevier
calculate the surface electrostatic potential of Pt 9 clusters, WC and Pt 7 /WC, as shown
in Fig. 4.25. Figure 4.25 show the structure and surface electrostatic potential of the
Pt 9 cluster and WC, respectively. It can be seen from the figure that the regions
with high negative electron density are concentrated in the red central atomic region,
indicating that they all have “strong electron-donating” characteristics. It is worth
noting that W atom clusters have a higher negative electron density, which means
that W atom clusters have a stronger electron-donating ability. In addition, when Pt is
supported on a WC carrier, its negative electron center is transferred to the periphery
of Pt, and W atoms no longer have a high negative electron density around them.