

9 Mössbauer Spectroscopic Studies on Atomic Diffusion in Materials
463
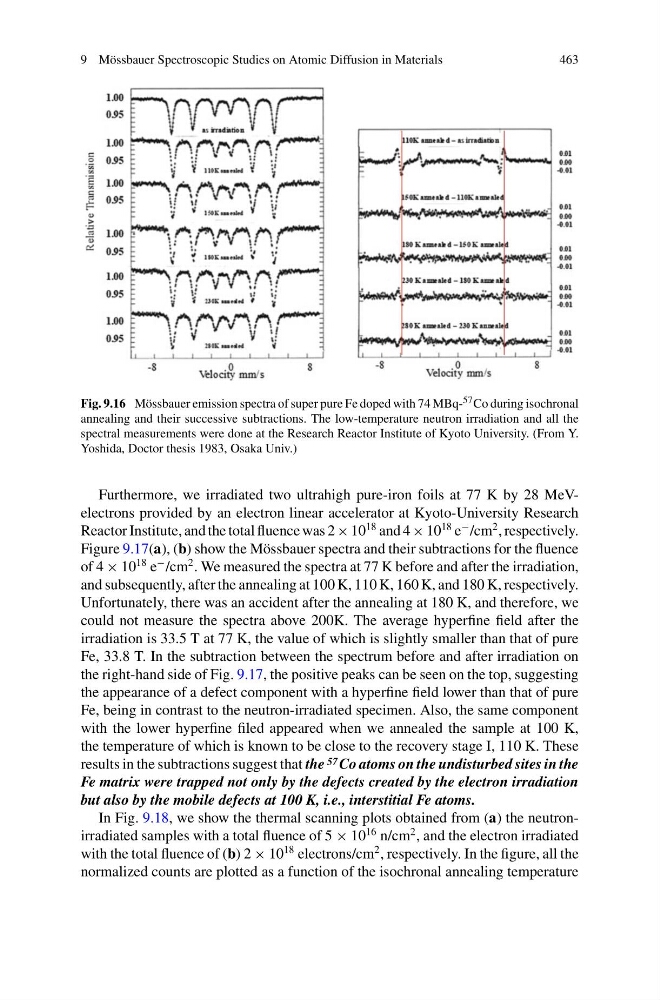
Fig. 9.16 Mössbauer emission spectra of super pure Fe doped with 74 MBq- 57 Co during isochronal
annealing and their successive subtractions. The low-temperature neutron irradiation and all the
spectral measurements were done at the Research Reactor Institute of Kyoto University. (From Y.
Yoshida, Doctor thesis 1983, Osaka Univ.)
Furthermore, we irradiated two ultrahigh pure-iron foils at 77 K by 28 MeVelectrons provided by an electron linear accelerator at Kyoto-University Research
Reactor Institute, and the total fluence was 2 × 10
18 and 4 × 10
18 e
− /cm
2 , respectively.
Figure 9.17(a), (b) show the Mössbauer spectra and their subtractions for the fluence
of 4 × 10
18 e
− /cm
2 . We measured the spectra at 77 K before and after the irradiation,
and subsequently, after the annealing at 100 K, 110 K, 160 K, and 180 K, respectively.
Unfortunately, there was an accident after the annealing at 180 K, and therefore, we
could not measure the spectra above 200K. The average hyperfine field after the
irradiation is 33.5 T at 77 K, the value of which is slightly smaller than that of pure
Fe, 33.8 T. In the subtraction between the spectrum before and after irradiation on
the right-hand side of Fig. 9.17, the positive peaks can be seen on the top, suggesting
the appearance of a defect component with a hyperfine field lower than that of pure
Fe, being in contrast to the neutron-irradiated specimen. Also, the same component
with the lower hyperfine filed appeared when we annealed the sample at 100 K,
the temperature of which is known to be close to the recovery stage I, 110 K. These
results in the subtractions suggest that the 57 Co atoms on the undisturbed sites in the
Fe matrix were trapped not only by the defects created by the electron irradiation
but also by the mobile defects at 100 K, i.e., interstitial Fe atoms.
In Fig. 9.18, we show the thermal scanning plots obtained from (a) the neutronirradiated samples with a total fluence of 5 × 10
16 n/cm
2 , and the electron irradiated
with the total fluence of (b) 2 × 10
18 electrons/cm
2 , respectively. In the figure, all the
normalized counts are plotted as a function of the isochronal annealing temperature
463
Fig. 9.16 Mössbauer emission spectra of super pure Fe doped with 74 MBq- 57 Co during isochronal
annealing and their successive subtractions. The low-temperature neutron irradiation and all the
spectral measurements were done at the Research Reactor Institute of Kyoto University. (From Y.
Yoshida, Doctor thesis 1983, Osaka Univ.)
Furthermore, we irradiated two ultrahigh pure-iron foils at 77 K by 28 MeVelectrons provided by an electron linear accelerator at Kyoto-University Research
Reactor Institute, and the total fluence was 2 × 10
18 and 4 × 10
18 e
− /cm
2 , respectively.
Figure 9.17(a), (b) show the Mössbauer spectra and their subtractions for the fluence
of 4 × 10
18 e
− /cm
2 . We measured the spectra at 77 K before and after the irradiation,
and subsequently, after the annealing at 100 K, 110 K, 160 K, and 180 K, respectively.
Unfortunately, there was an accident after the annealing at 180 K, and therefore, we
could not measure the spectra above 200K. The average hyperfine field after the
irradiation is 33.5 T at 77 K, the value of which is slightly smaller than that of pure
Fe, 33.8 T. In the subtraction between the spectrum before and after irradiation on
the right-hand side of Fig. 9.17, the positive peaks can be seen on the top, suggesting
the appearance of a defect component with a hyperfine field lower than that of pure
Fe, being in contrast to the neutron-irradiated specimen. Also, the same component
with the lower hyperfine filed appeared when we annealed the sample at 100 K,
the temperature of which is known to be close to the recovery stage I, 110 K. These
results in the subtractions suggest that the 57 Co atoms on the undisturbed sites in the
Fe matrix were trapped not only by the defects created by the electron irradiation
but also by the mobile defects at 100 K, i.e., interstitial Fe atoms.
In Fig. 9.18, we show the thermal scanning plots obtained from (a) the neutronirradiated samples with a total fluence of 5 × 10
16 n/cm
2 , and the electron irradiated
with the total fluence of (b) 2 × 10
18 electrons/cm
2 , respectively. In the figure, all the
normalized counts are plotted as a function of the isochronal annealing temperature