

8 Mössbauer Spectroscopy in External Magnetic Fields
433
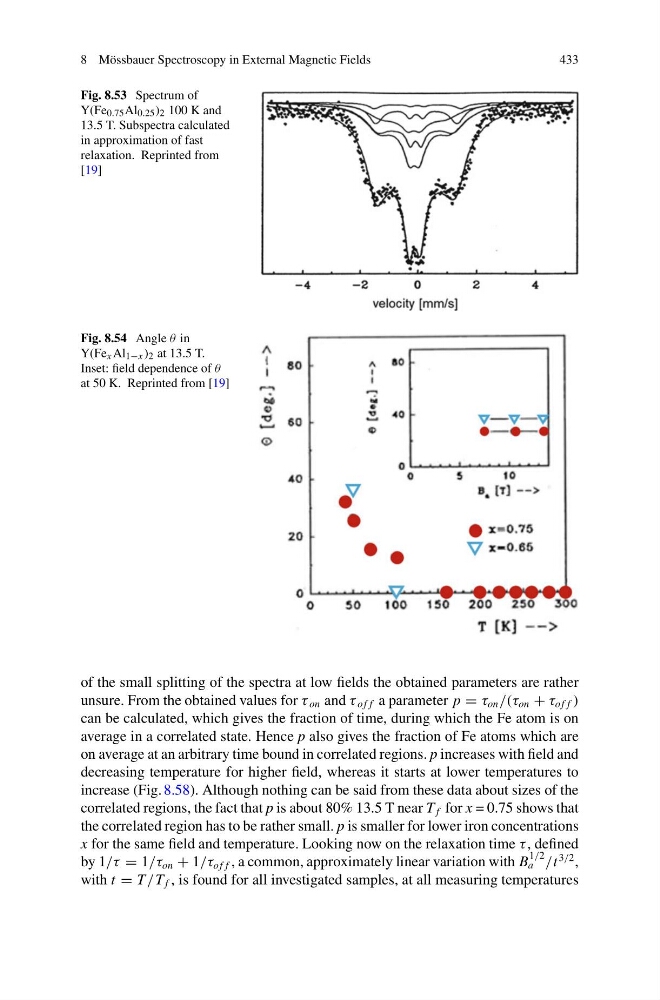
Fig. 8.53 Spectrum of
Y(Fe 0.75 Al 0.25 ) 2 100 K and
13.5 T. Subspectra calculated
in approximation of fast
relaxation. Reprinted from
[19]
Fig. 8.54 Angle θ in
Y(Fe x Al 1−x ) 2 at 13.5 T.
Inset: field dependence of θ
at 50 K. Reprinted from [19]
of the small splitting of the spectra at low fields the obtained parameters are rather
unsure. From the obtained values for τ on and τ of f a parameter p = τ on /(τ on + τ of f )
can be calculated, which gives the fraction of time, during which the Fe atom is on
average in a correlated state. Hence p also gives the fraction of Fe atoms which are
on average at an arbitrary time bound in correlated regions. p increases with field and
decreasing temperature for higher field, whereas it starts at lower temperatures to
increase (Fig. 8.58). Although nothing can be said from these data about sizes of the
correlated regions, the fact that p is about 80% 13.5 T near T f for x = 0.75 shows that
the correlated region has to be rather small. p is smaller for lower iron concentrations
x for the same field and temperature. Looking now on the relaxation time τ , defined
by 1/τ = 1/τ on + 1/τ of f , a common, approximately linear variation with B
1/2
a /t
3/2 ,
with t = T /T f , is found for all investigated samples, at all measuring temperatures
433
Fig. 8.53 Spectrum of
Y(Fe 0.75 Al 0.25 ) 2 100 K and
13.5 T. Subspectra calculated
in approximation of fast
relaxation. Reprinted from
[19]
Fig. 8.54 Angle θ in
Y(Fe x Al 1−x ) 2 at 13.5 T.
Inset: field dependence of θ
at 50 K. Reprinted from [19]
of the small splitting of the spectra at low fields the obtained parameters are rather
unsure. From the obtained values for τ on and τ of f a parameter p = τ on /(τ on + τ of f )
can be calculated, which gives the fraction of time, during which the Fe atom is on
average in a correlated state. Hence p also gives the fraction of Fe atoms which are
on average at an arbitrary time bound in correlated regions. p increases with field and
decreasing temperature for higher field, whereas it starts at lower temperatures to
increase (Fig. 8.58). Although nothing can be said from these data about sizes of the
correlated regions, the fact that p is about 80% 13.5 T near T f for x = 0.75 shows that
the correlated region has to be rather small. p is smaller for lower iron concentrations
x for the same field and temperature. Looking now on the relaxation time τ , defined
by 1/τ = 1/τ on + 1/τ of f , a common, approximately linear variation with B
1/2
a /t
3/2 ,
with t = T /T f , is found for all investigated samples, at all measuring temperatures