

302
N. Kojima and A. Okazawa
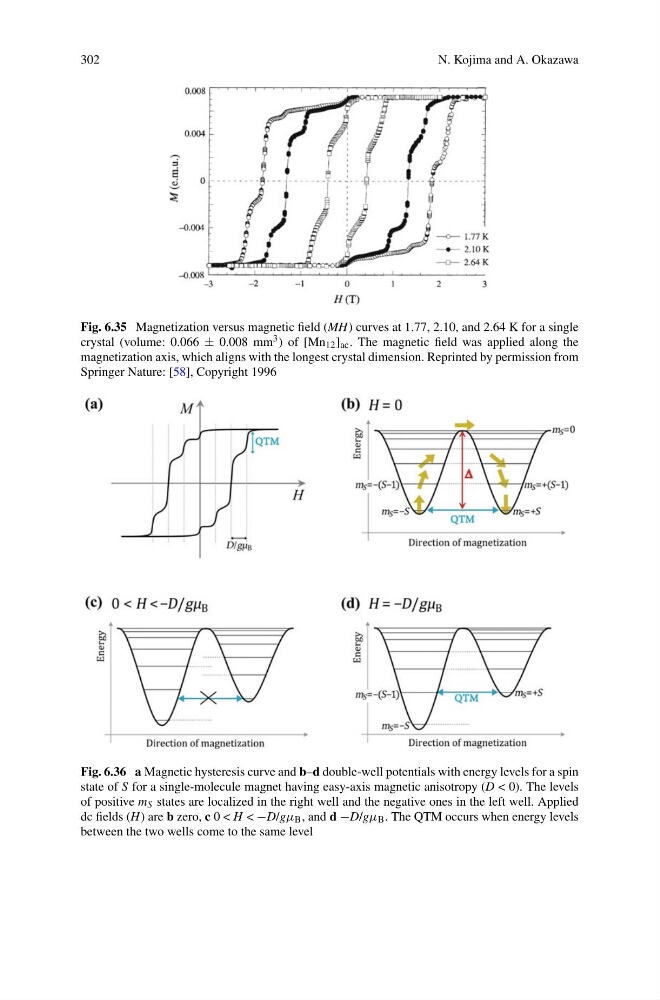
Fig. 6.35 Magnetization versus magnetic field (MH) curves at 1.77, 2.10, and 2.64 K for a single
crystal (volume: 0.066 ± 0.008 mm 3 ) of [Mn 12 ] ac . The magnetic field was applied along the
magnetization axis, which aligns with the longest crystal dimension. Reprinted by permission from
Springer Nature: [58], Copyright 1996
Fig. 6.36 a Magnetic hysteresis curve and b–d double-well potentials with energy levels for a spin
state of S for a single-molecule magnet having easy-axis magnetic anisotropy (D < 0). The levels
of positive m S states are localized in the right well and the negative ones in the left well. Applied
dc fields (H) are b zero, c 0 < H < −D/gμ B , and d −D/gμ B . The QTM occurs when energy levels
between the two wells come to the same level
N. Kojima and A. Okazawa
Fig. 6.35 Magnetization versus magnetic field (MH) curves at 1.77, 2.10, and 2.64 K for a single
crystal (volume: 0.066 ± 0.008 mm 3 ) of [Mn 12 ] ac . The magnetic field was applied along the
magnetization axis, which aligns with the longest crystal dimension. Reprinted by permission from
Springer Nature: [58], Copyright 1996
Fig. 6.36 a Magnetic hysteresis curve and b–d double-well potentials with energy levels for a spin
state of S for a single-molecule magnet having easy-axis magnetic anisotropy (D < 0). The levels
of positive m S states are localized in the right well and the negative ones in the left well. Applied
dc fields (H) are b zero, c 0 < H < −D/gμ B , and d −D/gμ B . The QTM occurs when energy levels
between the two wells come to the same level