

3 Quantum Optical Phenomena in Nuclear Resonant Scattering
149
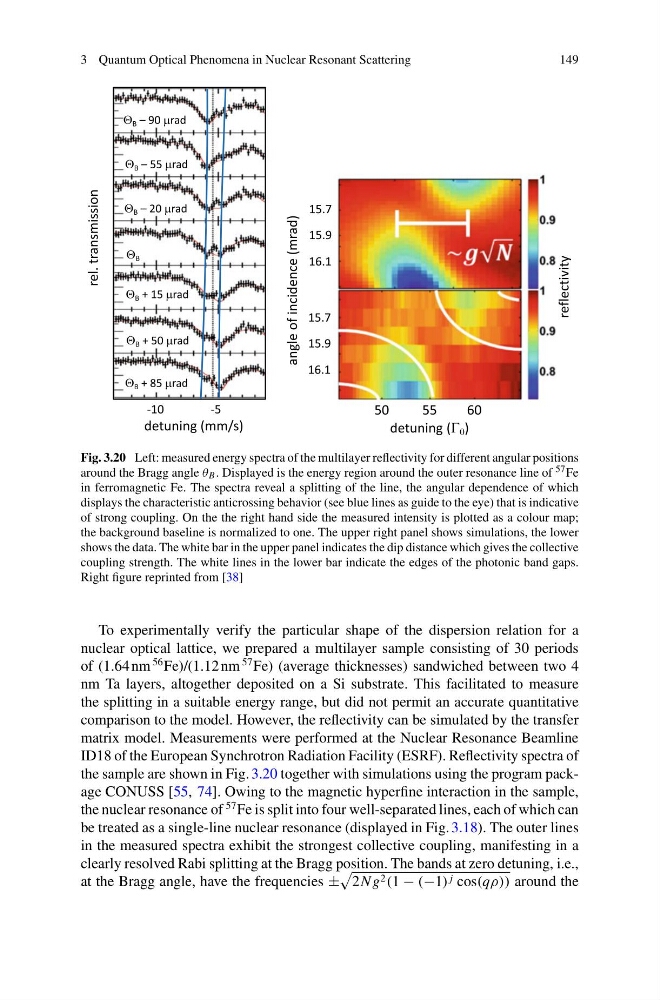
Fig. 3.20 Left: measured energy spectra of the multilayer reflectivity for different angular positions
around the Bragg angle θ B . Displayed is the energy region around the outer resonance line of 57 Fe
in ferromagnetic Fe. The spectra reveal a splitting of the line, the angular dependence of which
displays the characteristic anticrossing behavior (see blue lines as guide to the eye) that is indicative
of strong coupling. On the the right hand side the measured intensity is plotted as a colour map;
the background baseline is normalized to one. The upper right panel shows simulations, the lower
shows the data. The white bar in the upper panel indicates the dip distance which gives the collective
coupling strength. The white lines in the lower bar indicate the edges of the photonic band gaps.
Right figure reprinted from [38]
To experimentally verify the particular shape of the dispersion relation for a
nuclear optical lattice, we prepared a multilayer sample consisting of 30 periods
of (1.64 nm
56 Fe)/(1.12 nm
57 Fe) (average thicknesses) sandwiched between two 4
nm Ta layers, altogether deposited on a Si substrate. This facilitated to measure
the splitting in a suitable energy range, but did not permit an accurate quantitative
comparison to the model. However, the reflectivity can be simulated by the transfer
matrix model. Measurements were performed at the Nuclear Resonance Beamline
ID18 of the European Synchrotron Radiation Facility (ESRF). Reflectivity spectra of
the sample are shown in Fig. 3.20 together with simulations using the program package CONUSS [55, 74]. Owing to the magnetic hyperfine interaction in the sample,
the nuclear resonance of
57 Fe is split into four well-separated lines, each of which can
be treated as a single-line nuclear resonance (displayed in Fig. 3.18). The outer lines
in the measured spectra exhibit the strongest collective coupling, manifesting in a
clearly resolved Rabi splitting at the Bragg position. The bands at zero detuning, i.e.,
at the Bragg angle, have the frequencies ±
2Ng 2 (1 − (−1) j cos(qρ)) around the
149
Fig. 3.20 Left: measured energy spectra of the multilayer reflectivity for different angular positions
around the Bragg angle θ B . Displayed is the energy region around the outer resonance line of 57 Fe
in ferromagnetic Fe. The spectra reveal a splitting of the line, the angular dependence of which
displays the characteristic anticrossing behavior (see blue lines as guide to the eye) that is indicative
of strong coupling. On the the right hand side the measured intensity is plotted as a colour map;
the background baseline is normalized to one. The upper right panel shows simulations, the lower
shows the data. The white bar in the upper panel indicates the dip distance which gives the collective
coupling strength. The white lines in the lower bar indicate the edges of the photonic band gaps.
Right figure reprinted from [38]
To experimentally verify the particular shape of the dispersion relation for a
nuclear optical lattice, we prepared a multilayer sample consisting of 30 periods
of (1.64 nm
56 Fe)/(1.12 nm
57 Fe) (average thicknesses) sandwiched between two 4
nm Ta layers, altogether deposited on a Si substrate. This facilitated to measure
the splitting in a suitable energy range, but did not permit an accurate quantitative
comparison to the model. However, the reflectivity can be simulated by the transfer
matrix model. Measurements were performed at the Nuclear Resonance Beamline
ID18 of the European Synchrotron Radiation Facility (ESRF). Reflectivity spectra of
the sample are shown in Fig. 3.20 together with simulations using the program package CONUSS [55, 74]. Owing to the magnetic hyperfine interaction in the sample,
the nuclear resonance of
57 Fe is split into four well-separated lines, each of which can
be treated as a single-line nuclear resonance (displayed in Fig. 3.18). The outer lines
in the measured spectra exhibit the strongest collective coupling, manifesting in a
clearly resolved Rabi splitting at the Bragg position. The bands at zero detuning, i.e.,
at the Bragg angle, have the frequencies ±
2Ng 2 (1 − (−1) j cos(qρ)) around the