

9 Mössbauer Spectroscopic Studies on Atomic Diffusion in Materials
507
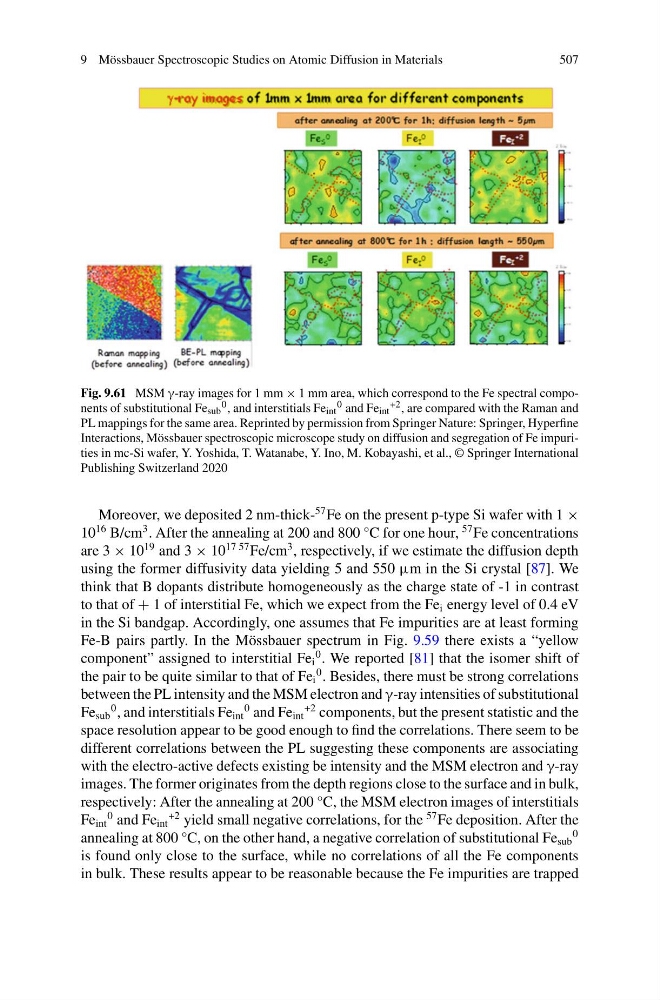
Fig. 9.61 MSM γ-ray images for 1 mm × 1 mm area, which correspond to the Fe spectral components of substitutional Fe sub
0 , and interstitials Fe int
0 and Fe int
+2 , are compared with the Raman and
PL mappings for the same area. Reprinted by permission from Springer Nature: Springer, Hyperfine
Interactions, Mössbauer spectroscopic microscope study on diffusion and segregation of Fe impurities in mc-Si wafer, Y. Yoshida, T. Watanabe, Y. Ino, M. Kobayashi, et al., © Springer International
Publishing Switzerland 2020
Moreover, we deposited 2 nm-thick57 Fe on the present p-type Si wafer with 1 ×
10
16 B/cm
3 . After the annealing at 200 and 800 °C for one hour,
57 Fe concentrations
are 3 × 10
19 and 3 × 10
17 57 Fe/cm
3 , respectively, if we estimate the diffusion depth
using the former diffusivity data yielding 5 and 550 μm in the Si crystal [87]. We
think that B dopants distribute homogeneously as the charge state of -1 in contrast
to that of + 1 of interstitial Fe, which we expect from the Fe i energy level of 0.4 eV
in the Si bandgap. Accordingly, one assumes that Fe impurities are at least forming
Fe-B pairs partly. In the Mössbauer spectrum in Fig. 9.59 there exists a “yellow
component” assigned to interstitial Fe i
0 . We reported [81] that the isomer shift of
the pair to be quite similar to that of Fe i
0 . Besides, there must be strong correlations
between the PL intensity and the MSM electron and γ-ray intensities of substitutional
Fe sub
0 , and interstitials Fe int
0 and Fe int
+2 components, but the present statistic and the
space resolution appear to be good enough to find the correlations. There seem to be
different correlations between the PL suggesting these components are associating
with the electro-active defects existing be intensity and the MSM electron and γ-ray
images. The former originates from the depth regions close to the surface and in bulk,
respectively: After the annealing at 200 °C, the MSM electron images of interstitials
Fe int
0 and Fe int
+2 yield small negative correlations, for the
57 Fe deposition. After the
annealing at 800 °C, on the other hand, a negative correlation of substitutional Fe sub
0
is found only close to the surface, while no correlations of all the Fe components
in bulk. These results appear to be reasonable because the Fe impurities are trapped
507
Fig. 9.61 MSM γ-ray images for 1 mm × 1 mm area, which correspond to the Fe spectral components of substitutional Fe sub
0 , and interstitials Fe int
0 and Fe int
+2 , are compared with the Raman and
PL mappings for the same area. Reprinted by permission from Springer Nature: Springer, Hyperfine
Interactions, Mössbauer spectroscopic microscope study on diffusion and segregation of Fe impurities in mc-Si wafer, Y. Yoshida, T. Watanabe, Y. Ino, M. Kobayashi, et al., © Springer International
Publishing Switzerland 2020
Moreover, we deposited 2 nm-thick57 Fe on the present p-type Si wafer with 1 ×
10
16 B/cm
3 . After the annealing at 200 and 800 °C for one hour,
57 Fe concentrations
are 3 × 10
19 and 3 × 10
17 57 Fe/cm
3 , respectively, if we estimate the diffusion depth
using the former diffusivity data yielding 5 and 550 μm in the Si crystal [87]. We
think that B dopants distribute homogeneously as the charge state of -1 in contrast
to that of + 1 of interstitial Fe, which we expect from the Fe i energy level of 0.4 eV
in the Si bandgap. Accordingly, one assumes that Fe impurities are at least forming
Fe-B pairs partly. In the Mössbauer spectrum in Fig. 9.59 there exists a “yellow
component” assigned to interstitial Fe i
0 . We reported [81] that the isomer shift of
the pair to be quite similar to that of Fe i
0 . Besides, there must be strong correlations
between the PL intensity and the MSM electron and γ-ray intensities of substitutional
Fe sub
0 , and interstitials Fe int
0 and Fe int
+2 components, but the present statistic and the
space resolution appear to be good enough to find the correlations. There seem to be
different correlations between the PL suggesting these components are associating
with the electro-active defects existing be intensity and the MSM electron and γ-ray
images. The former originates from the depth regions close to the surface and in bulk,
respectively: After the annealing at 200 °C, the MSM electron images of interstitials
Fe int
0 and Fe int
+2 yield small negative correlations, for the
57 Fe deposition. After the
annealing at 800 °C, on the other hand, a negative correlation of substitutional Fe sub
0
is found only close to the surface, while no correlations of all the Fe components
in bulk. These results appear to be reasonable because the Fe impurities are trapped