

502
Y. Yoshida
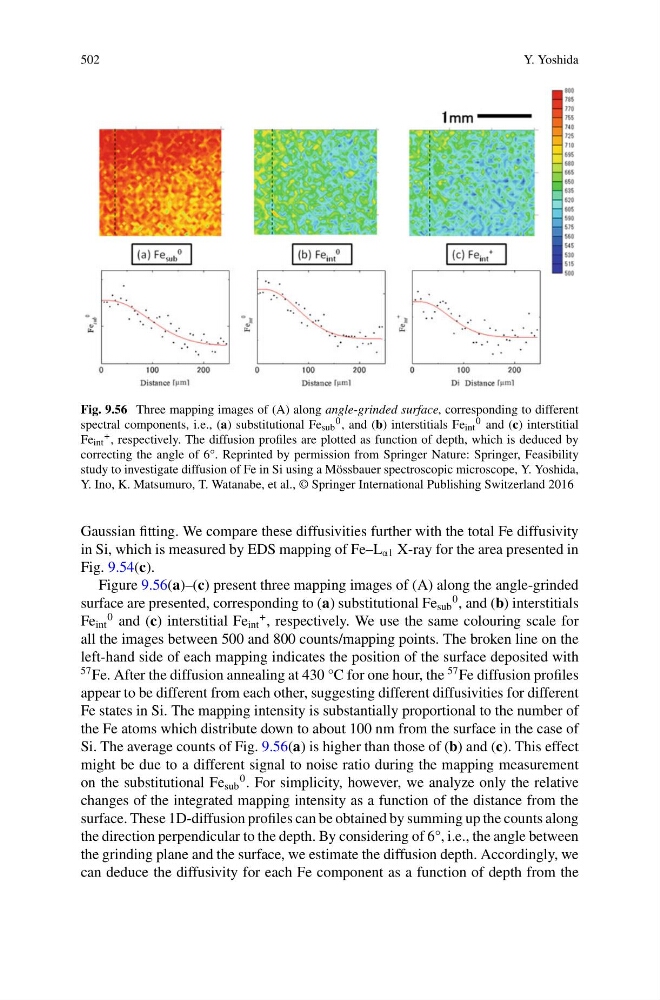
Fig. 9.56 Three mapping images of (A) along angle-grinded surface, corresponding to different
spectral components, i.e., (a) substitutional Fe sub
0 , and (b) interstitials Fe int
0 and (c) interstitial
Fe int
+ , respectively. The diffusion profiles are plotted as function of depth, which is deduced by
correcting the angle of 6°. Reprinted by permission from Springer Nature: Springer, Feasibility
study to investigate diffusion of Fe in Si using a Mössbauer spectroscopic microscope, Y. Yoshida,
Y. Ino, K. Matsumuro, T. Watanabe, et al., © Springer International Publishing Switzerland 2016
Gaussian fitting. We compare these diffusivities further with the total Fe diffusivity
in Si, which is measured by EDS mapping of Fe–L α1 X-ray for the area presented in
Fig. 9.54(c).
Figure 9.56(a)–(c) present three mapping images of (A) along the angle-grinded
surface are presented, corresponding to (a) substitutional Fe sub
0 , and (b) interstitials
Fe int
0 and (c) interstitial Fe int
+ , respectively. We use the same colouring scale for
all the images between 500 and 800 counts/mapping points. The broken line on the
left-hand side of each mapping indicates the position of the surface deposited with
57 Fe. After the diffusion annealing at 430 °C for one hour, the
57 Fe diffusion profiles
appear to be different from each other, suggesting different diffusivities for different
Fe states in Si. The mapping intensity is substantially proportional to the number of
the Fe atoms which distribute down to about 100 nm from the surface in the case of
Si. The average counts of Fig. 9.56(a) is higher than those of (b) and (c). This effect
might be due to a different signal to noise ratio during the mapping measurement
on the substitutional Fe sub
0 . For simplicity, however, we analyze only the relative
changes of the integrated mapping intensity as a function of the distance from the
surface. These 1D-diffusion profiles can be obtained by summing up the counts along
the direction perpendicular to the depth. By considering of 6°, i.e., the angle between
the grinding plane and the surface, we estimate the diffusion depth. Accordingly, we
can deduce the diffusivity for each Fe component as a function of depth from the
Y. Yoshida
Fig. 9.56 Three mapping images of (A) along angle-grinded surface, corresponding to different
spectral components, i.e., (a) substitutional Fe sub
0 , and (b) interstitials Fe int
0 and (c) interstitial
Fe int
+ , respectively. The diffusion profiles are plotted as function of depth, which is deduced by
correcting the angle of 6°. Reprinted by permission from Springer Nature: Springer, Feasibility
study to investigate diffusion of Fe in Si using a Mössbauer spectroscopic microscope, Y. Yoshida,
Y. Ino, K. Matsumuro, T. Watanabe, et al., © Springer International Publishing Switzerland 2016
Gaussian fitting. We compare these diffusivities further with the total Fe diffusivity
in Si, which is measured by EDS mapping of Fe–L α1 X-ray for the area presented in
Fig. 9.54(c).
Figure 9.56(a)–(c) present three mapping images of (A) along the angle-grinded
surface are presented, corresponding to (a) substitutional Fe sub
0 , and (b) interstitials
Fe int
0 and (c) interstitial Fe int
+ , respectively. We use the same colouring scale for
all the images between 500 and 800 counts/mapping points. The broken line on the
left-hand side of each mapping indicates the position of the surface deposited with
57 Fe. After the diffusion annealing at 430 °C for one hour, the
57 Fe diffusion profiles
appear to be different from each other, suggesting different diffusivities for different
Fe states in Si. The mapping intensity is substantially proportional to the number of
the Fe atoms which distribute down to about 100 nm from the surface in the case of
Si. The average counts of Fig. 9.56(a) is higher than those of (b) and (c). This effect
might be due to a different signal to noise ratio during the mapping measurement
on the substitutional Fe sub
0 . For simplicity, however, we analyze only the relative
changes of the integrated mapping intensity as a function of the distance from the
surface. These 1D-diffusion profiles can be obtained by summing up the counts along
the direction perpendicular to the depth. By considering of 6°, i.e., the angle between
the grinding plane and the surface, we estimate the diffusion depth. Accordingly, we
can deduce the diffusivity for each Fe component as a function of depth from the