

452
Y. Yoshida
Velocity scale against Laboratory(mms -1 )
Velocity scale against α-Fe (mms -1 )
Energy Shift (eV)
× 10 -7
δ = +0.109
mms -1
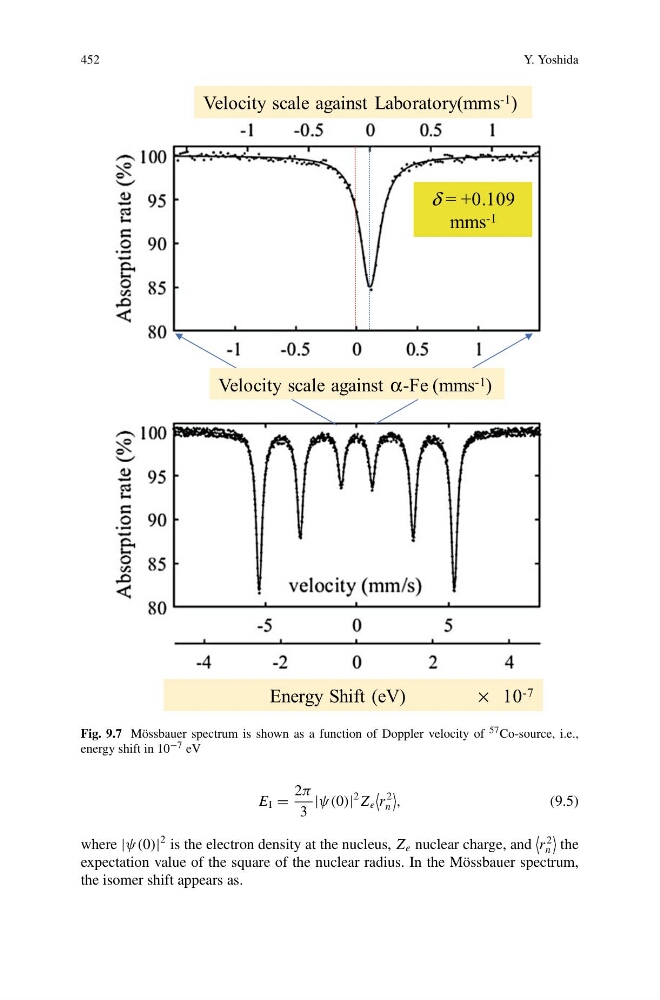
Fig. 9.7 Mössbauer spectrum is shown as a function of Doppler velocity of 57 Co-source, i.e.,
energy shift in 10 −7 eV
E I =
2π
3
|ψ(0)|
2 Z e
r
2
n
,
(9.5)
where |ψ(0)|
2 is the electron density at the nucleus, Z e nuclear charge, and
r
2
n
the
expectation value of the square of the nuclear radius. In the Mössbauer spectrum,
the isomer shift appears as.
Y. Yoshida
Velocity scale against Laboratory(mms -1 )
Velocity scale against α-Fe (mms -1 )
Energy Shift (eV)
× 10 -7
δ = +0.109
mms -1
Fig. 9.7 Mössbauer spectrum is shown as a function of Doppler velocity of 57 Co-source, i.e.,
energy shift in 10 −7 eV
E I =
2π
3
|ψ(0)|
2 Z e
r
2
n
,
(9.5)
where |ψ(0)|
2 is the electron density at the nucleus, Z e nuclear charge, and
r
2
n
the
expectation value of the square of the nuclear radius. In the Mössbauer spectrum,
the isomer shift appears as.