

8 Mössbauer Spectroscopy in External Magnetic Fields
391
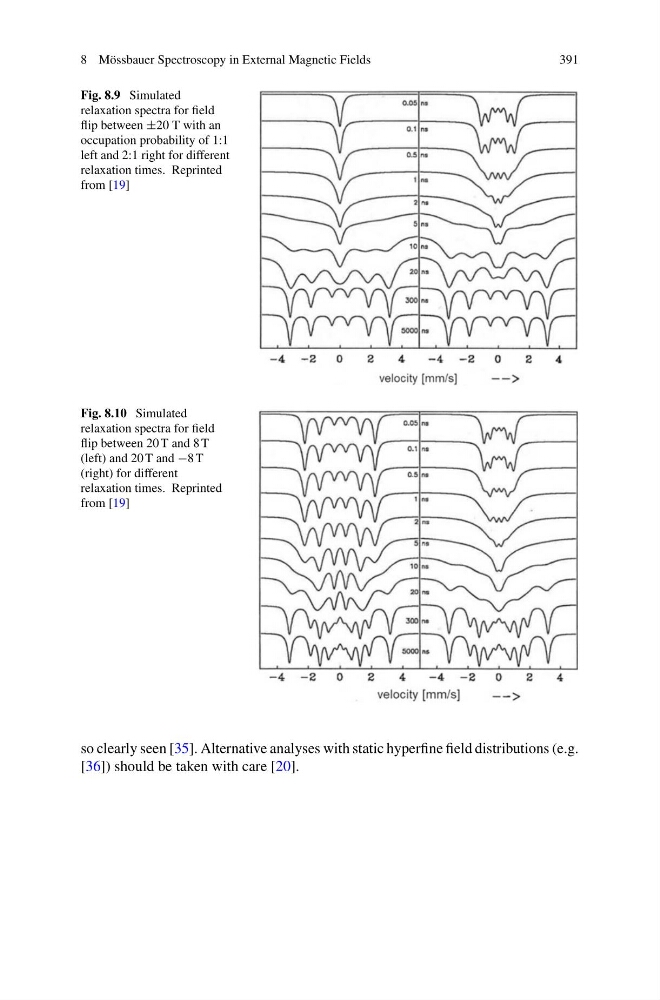
Fig. 8.9 Simulated
relaxation spectra for field
flip between ±20 T with an
occupation probability of 1:1
left and 2:1 right for different
relaxation times. Reprinted
from [19]
Fig. 8.10 Simulated
relaxation spectra for field
flip between 20 T and 8 T
(left) and 20 T and −8 T
(right) for different
relaxation times. Reprinted
from [19]
so clearly seen [35]. Alternative analyses with static hyperfine field distributions (e.g.
[36]) should be taken with care [20].
391
Fig. 8.9 Simulated
relaxation spectra for field
flip between ±20 T with an
occupation probability of 1:1
left and 2:1 right for different
relaxation times. Reprinted
from [19]
Fig. 8.10 Simulated
relaxation spectra for field
flip between 20 T and 8 T
(left) and 20 T and −8 T
(right) for different
relaxation times. Reprinted
from [19]
so clearly seen [35]. Alternative analyses with static hyperfine field distributions (e.g.
[36]) should be taken with care [20].