

370
P.-E. Lippens
(a)
57
Fe Mössbauer spectroscopy (b)
119
Sn Mössbauer spectroscopy (c)
119
Sn Mössbauer spectroscopy
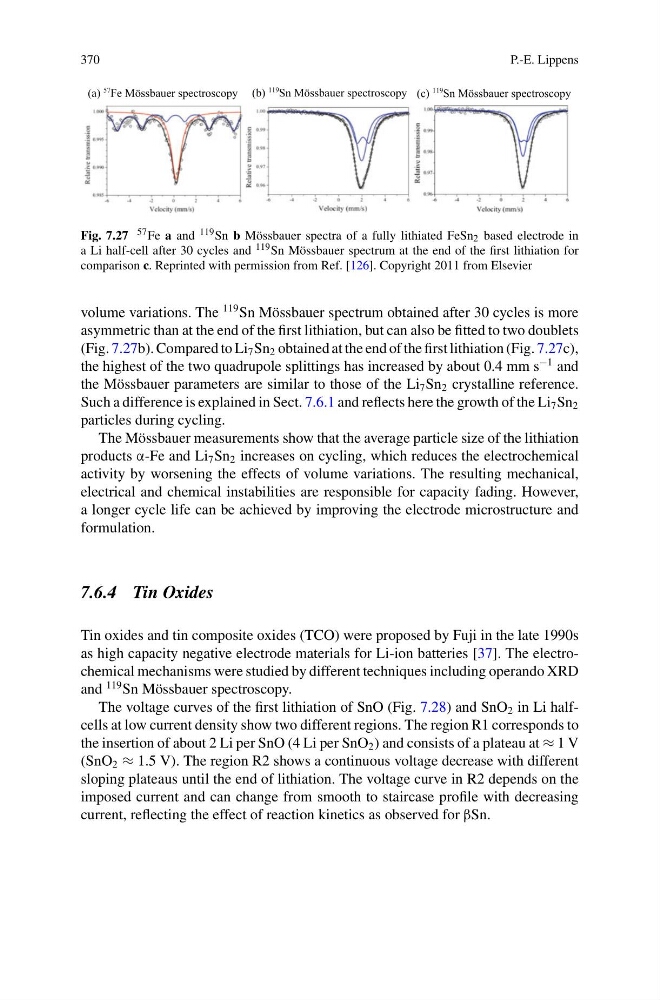
Fig. 7.27 57 Fe a and 119 Sn b Mössbauer spectra of a fully lithiated FeSn 2 based electrode in
a Li half-cell after 30 cycles and 119 Sn Mössbauer spectrum at the end of the first lithiation for
comparison c. Reprinted with permission from Ref. [126]. Copyright 2011 from Elsevier
volume variations. The
119 Sn Mössbauer spectrum obtained after 30 cycles is more
asymmetric than at the end of the first lithiation, but can also be fitted to two doublets
(Fig. 7.27b). Compared to Li 7 Sn 2 obtained at the end of the first lithiation (Fig. 7.27c),
the highest of the two quadrupole splittings has increased by about 0.4 mm s
−1 and
the Mössbauer parameters are similar to those of the Li 7 Sn 2 crystalline reference.
Such a difference is explained in Sect. 7.6.1 and reflects here the growth of the Li 7 Sn 2
particles during cycling.
The Mössbauer measurements show that the average particle size of the lithiation
products α-Fe and Li 7 Sn 2 increases on cycling, which reduces the electrochemical
activity by worsening the effects of volume variations. The resulting mechanical,
electrical and chemical instabilities are responsible for capacity fading. However,
a longer cycle life can be achieved by improving the electrode microstructure and
formulation.
7.6.4 Tin Oxides
Tin oxides and tin composite oxides (TCO) were proposed by Fuji in the late 1990s
as high capacity negative electrode materials for Li-ion batteries [37]. The electrochemical mechanisms were studied by different techniques including operando XRD
and
119 Sn Mössbauer spectroscopy.
The voltage curves of the first lithiation of SnO (Fig. 7.28) and SnO 2 in Li halfcells at low current density show two different regions. The region R1 corresponds to
the insertion of about 2 Li per SnO (4 Li per SnO 2 ) and consists of a plateau at ≈ 1 V
(SnO 2 ≈ 1.5 V). The region R2 shows a continuous voltage decrease with different
sloping plateaus until the end of lithiation. The voltage curve in R2 depends on the
imposed current and can change from smooth to staircase profile with decreasing
current, reflecting the effect of reaction kinetics as observed for βSn.
P.-E. Lippens
(a)
57
Fe Mössbauer spectroscopy (b)
119
Sn Mössbauer spectroscopy (c)
119
Sn Mössbauer spectroscopy
Fig. 7.27 57 Fe a and 119 Sn b Mössbauer spectra of a fully lithiated FeSn 2 based electrode in
a Li half-cell after 30 cycles and 119 Sn Mössbauer spectrum at the end of the first lithiation for
comparison c. Reprinted with permission from Ref. [126]. Copyright 2011 from Elsevier
volume variations. The
119 Sn Mössbauer spectrum obtained after 30 cycles is more
asymmetric than at the end of the first lithiation, but can also be fitted to two doublets
(Fig. 7.27b). Compared to Li 7 Sn 2 obtained at the end of the first lithiation (Fig. 7.27c),
the highest of the two quadrupole splittings has increased by about 0.4 mm s
−1 and
the Mössbauer parameters are similar to those of the Li 7 Sn 2 crystalline reference.
Such a difference is explained in Sect. 7.6.1 and reflects here the growth of the Li 7 Sn 2
particles during cycling.
The Mössbauer measurements show that the average particle size of the lithiation
products α-Fe and Li 7 Sn 2 increases on cycling, which reduces the electrochemical
activity by worsening the effects of volume variations. The resulting mechanical,
electrical and chemical instabilities are responsible for capacity fading. However,
a longer cycle life can be achieved by improving the electrode microstructure and
formulation.
7.6.4 Tin Oxides
Tin oxides and tin composite oxides (TCO) were proposed by Fuji in the late 1990s
as high capacity negative electrode materials for Li-ion batteries [37]. The electrochemical mechanisms were studied by different techniques including operando XRD
and
119 Sn Mössbauer spectroscopy.
The voltage curves of the first lithiation of SnO (Fig. 7.28) and SnO 2 in Li halfcells at low current density show two different regions. The region R1 corresponds to
the insertion of about 2 Li per SnO (4 Li per SnO 2 ) and consists of a plateau at ≈ 1 V
(SnO 2 ≈ 1.5 V). The region R2 shows a continuous voltage decrease with different
sloping plateaus until the end of lithiation. The voltage curve in R2 depends on the
imposed current and can change from smooth to staircase profile with decreasing
current, reflecting the effect of reaction kinetics as observed for βSn.