

7 Application of Mössbauer Spectroscopy to Li-Ion and Na-Ion …
343
7.4 Insertion Reactions
7.4.1 Solid-Solution Reactions
The solid-solution reactions refer to the insertion of Li
+ or Na
+ ions on the vacant
sites of a solid without phase transition. To illustrate the application of Mössbauer spectroscopy, the example considered here is the Nasicon-type (sodium super
ionic conductor) compound Na 1.5 Fe 0.5 Ti 1.5 (PO 4 ) 3 proposed as electrode material
for Na-ion batteries and studied with two different operando protocols [71, 72].
Na 1.5 Fe 0.5 Ti 1.5 (PO 4 ) 3 sub-micrometer particles were obtained by solid-state reaction and coated with carbon to improve the electronic conductivity. The crystallinity was controlled by XRD while DFT calculations confirmed the preferential occupation of some vacant sites by Na in the pristine material. The crystal has
a rhombohedral R ¯
3c structure with a random occupation of the metal sites (12c)
by 25% Fe and 75% Ti. The
57 Fe Mössbauer spectrum of Na 1.5 Fe 0.5 Ti 1.5 (PO 4 ) 3
consists of a doublet due to high spin Fe
3+ while the spectrum of the Ccoated sample Na 1.5 Fe 0.5 Ti 1.5 (PO 4 ) 3 /C was fitted to two doublets with Mössbauer
parameters: δ = 0.42 mm s
−1 , = 0.28 mm s
−1 assigned to high spin Fe
3+ (91%)
and δ = 1.18 mm s
−1 , = 2.37 mm s
−1 assigned to high spin Fe
2+ in impurities
arising from pyrolysis (9%).
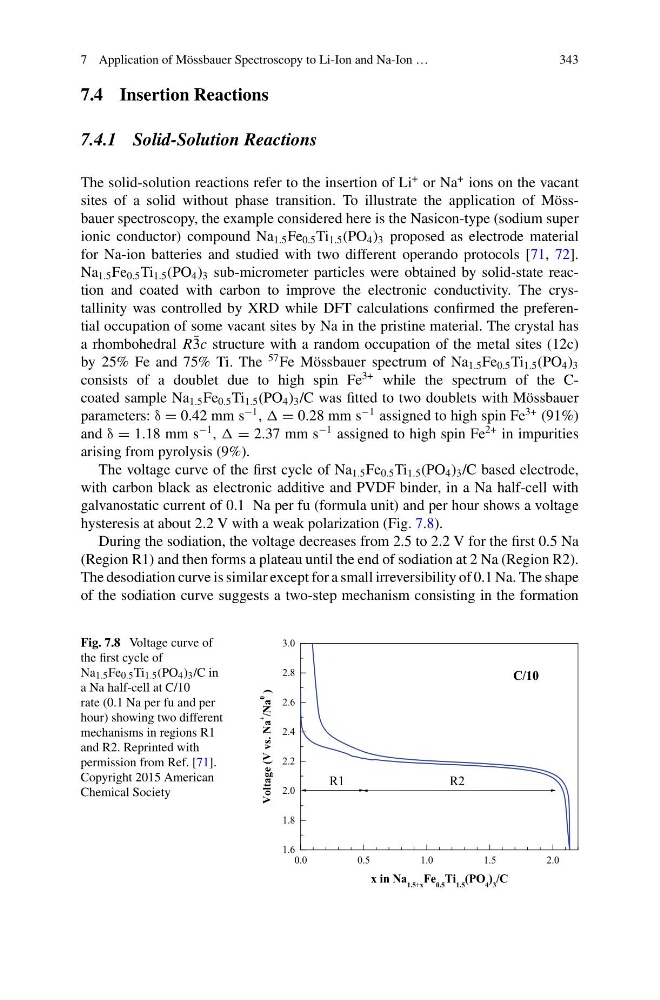
The voltage curve of the first cycle of Na 1.5 Fe 0.5 Ti 1.5 (PO 4 ) 3 /C based electrode,
with carbon black as electronic additive and PVDF binder, in a Na half-cell with
galvanostatic current of 0.1 Na per fu (formula unit) and per hour shows a voltage
hysteresis at about 2.2 V with a weak polarization (Fig. 7.8).
During the sodiation, the voltage decreases from 2.5 to 2.2 V for the first 0.5 Na
(Region R1) and then forms a plateau until the end of sodiation at 2 Na (Region R2).
The desodiation curve is similar except for a small irreversibility of 0.1 Na. The shape
of the sodiation curve suggests a two-step mechanism consisting in the formation
Fig. 7.8 Voltage curve of
the first cycle of
Na 1.5 Fe 0.5 Ti 1.5 (PO 4 ) 3 /C in
a Na half-cell at C/10
rate (0.1 Na per fu and per
hour) showing two different
mechanisms in regions R1
and R2. Reprinted with
permission from Ref. [71].
Copyright 2015 American
Chemical Society
0.0
0.5
1.0
1.5
2.0
1.6
1.8
2.0
2.2
2.4
2.6
2.8
3.0
R2
R1
C/10
Voltage (V vs. Na
+
/Na
0
)
x in Na 1.5+x Fe 0.5 Ti 1.5 (PO 4 ) 3 /C
343
7.4 Insertion Reactions
7.4.1 Solid-Solution Reactions
The solid-solution reactions refer to the insertion of Li
+ or Na
+ ions on the vacant
sites of a solid without phase transition. To illustrate the application of Mössbauer spectroscopy, the example considered here is the Nasicon-type (sodium super
ionic conductor) compound Na 1.5 Fe 0.5 Ti 1.5 (PO 4 ) 3 proposed as electrode material
for Na-ion batteries and studied with two different operando protocols [71, 72].
Na 1.5 Fe 0.5 Ti 1.5 (PO 4 ) 3 sub-micrometer particles were obtained by solid-state reaction and coated with carbon to improve the electronic conductivity. The crystallinity was controlled by XRD while DFT calculations confirmed the preferential occupation of some vacant sites by Na in the pristine material. The crystal has
a rhombohedral R ¯
3c structure with a random occupation of the metal sites (12c)
by 25% Fe and 75% Ti. The
57 Fe Mössbauer spectrum of Na 1.5 Fe 0.5 Ti 1.5 (PO 4 ) 3
consists of a doublet due to high spin Fe
3+ while the spectrum of the Ccoated sample Na 1.5 Fe 0.5 Ti 1.5 (PO 4 ) 3 /C was fitted to two doublets with Mössbauer
parameters: δ = 0.42 mm s
−1 , = 0.28 mm s
−1 assigned to high spin Fe
3+ (91%)
and δ = 1.18 mm s
−1 , = 2.37 mm s
−1 assigned to high spin Fe
2+ in impurities
arising from pyrolysis (9%).
The voltage curve of the first cycle of Na 1.5 Fe 0.5 Ti 1.5 (PO 4 ) 3 /C based electrode,
with carbon black as electronic additive and PVDF binder, in a Na half-cell with
galvanostatic current of 0.1 Na per fu (formula unit) and per hour shows a voltage
hysteresis at about 2.2 V with a weak polarization (Fig. 7.8).
During the sodiation, the voltage decreases from 2.5 to 2.2 V for the first 0.5 Na
(Region R1) and then forms a plateau until the end of sodiation at 2 Na (Region R2).
The desodiation curve is similar except for a small irreversibility of 0.1 Na. The shape
of the sodiation curve suggests a two-step mechanism consisting in the formation
Fig. 7.8 Voltage curve of
the first cycle of
Na 1.5 Fe 0.5 Ti 1.5 (PO 4 ) 3 /C in
a Na half-cell at C/10
rate (0.1 Na per fu and per
hour) showing two different
mechanisms in regions R1
and R2. Reprinted with
permission from Ref. [71].
Copyright 2015 American
Chemical Society
0.0
0.5
1.0
1.5
2.0
1.6
1.8
2.0
2.2
2.4
2.6
2.8
3.0
R2
R1
C/10
Voltage (V vs. Na
+
/Na
0
)
x in Na 1.5+x Fe 0.5 Ti 1.5 (PO 4 ) 3 /C