

292
N. Kojima and A. Okazawa
Table 6.1 Parameters obtained by fitting the Redfield equation to the subtracted depolarization
rate (λ CT ) between n = 3 and 5 for (n-C n H 2n+1 ) 4 N[Fe II Fe III (dto) 3 ] [5]
T (K)
τ c (μs)
H loc (mT)
60
0
80
5.7
0.40
110
10.6
0.19
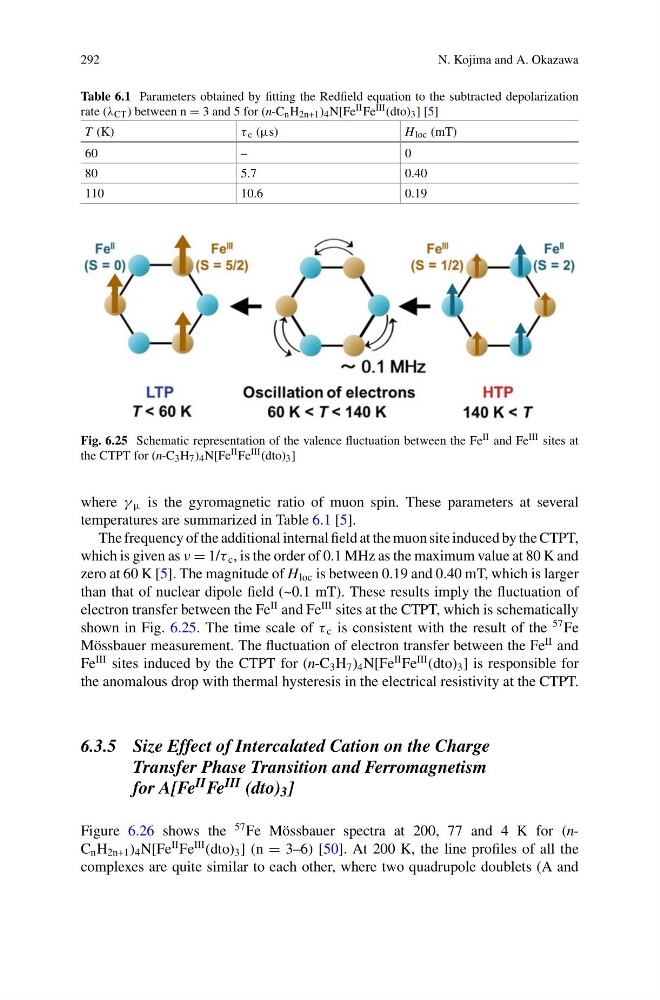
Fig. 6.25 Schematic representation of the valence fluctuation between the Fe II and Fe III sites at
the CTPT for (n-C 3 H 7 ) 4 N[Fe II Fe III (dto) 3 ]
where γ μ is the gyromagnetic ratio of muon spin. These parameters at several
temperatures are summarized in Table 6.1 [5].
The frequency of the additional internal field at the muon site induced by the CTPT,
which is given as ν = 1/τ c , is the order of 0.1 MHz as the maximum value at 80 K and
zero at 60 K [5]. The magnitude of H loc is between 0.19 and 0.40 mT, which is larger
than that of nuclear dipole field (~0.1 mT). These results imply the fluctuation of
electron transfer between the Fe
II and Fe
III sites at the CTPT, which is schematically
shown in Fig. 6.25. The time scale of τ c is consistent with the result of the
57 Fe
Mössbauer measurement. The fluctuation of electron transfer between the Fe
II and
Fe
III sites induced by the CTPT for (n-C 3 H 7 ) 4 N[Fe
II Fe
III (dto) 3 ] is responsible for
the anomalous drop with thermal hysteresis in the electrical resistivity at the CTPT.
6.3.5 Size Effect of Intercalated Cation on the Charge
Transfer Phase Transition and Ferromagnetism
for A[Fe II Fe III (dto) 3 ]
Figure 6.26 shows the
57 Fe Mössbauer spectra at 200, 77 and 4 K for (nC n H 2n+1 ) 4 N[Fe
II Fe
III (dto) 3 ] (n = 3–6) [50]. At 200 K, the line profiles of all the
complexes are quite similar to each other, where two quadrupole doublets (A and
N. Kojima and A. Okazawa
Table 6.1 Parameters obtained by fitting the Redfield equation to the subtracted depolarization
rate (λ CT ) between n = 3 and 5 for (n-C n H 2n+1 ) 4 N[Fe II Fe III (dto) 3 ] [5]
T (K)
τ c (μs)
H loc (mT)
60
0
80
5.7
0.40
110
10.6
0.19
Fig. 6.25 Schematic representation of the valence fluctuation between the Fe II and Fe III sites at
the CTPT for (n-C 3 H 7 ) 4 N[Fe II Fe III (dto) 3 ]
where γ μ is the gyromagnetic ratio of muon spin. These parameters at several
temperatures are summarized in Table 6.1 [5].
The frequency of the additional internal field at the muon site induced by the CTPT,
which is given as ν = 1/τ c , is the order of 0.1 MHz as the maximum value at 80 K and
zero at 60 K [5]. The magnitude of H loc is between 0.19 and 0.40 mT, which is larger
than that of nuclear dipole field (~0.1 mT). These results imply the fluctuation of
electron transfer between the Fe
II and Fe
III sites at the CTPT, which is schematically
shown in Fig. 6.25. The time scale of τ c is consistent with the result of the
57 Fe
Mössbauer measurement. The fluctuation of electron transfer between the Fe
II and
Fe
III sites induced by the CTPT for (n-C 3 H 7 ) 4 N[Fe
II Fe
III (dto) 3 ] is responsible for
the anomalous drop with thermal hysteresis in the electrical resistivity at the CTPT.
6.3.5 Size Effect of Intercalated Cation on the Charge
Transfer Phase Transition and Ferromagnetism
for A[Fe II Fe III (dto) 3 ]
Figure 6.26 shows the
57 Fe Mössbauer spectra at 200, 77 and 4 K for (nC n H 2n+1 ) 4 N[Fe
II Fe
III (dto) 3 ] (n = 3–6) [50]. At 200 K, the line profiles of all the
complexes are quite similar to each other, where two quadrupole doublets (A and